What Each One Actually Is
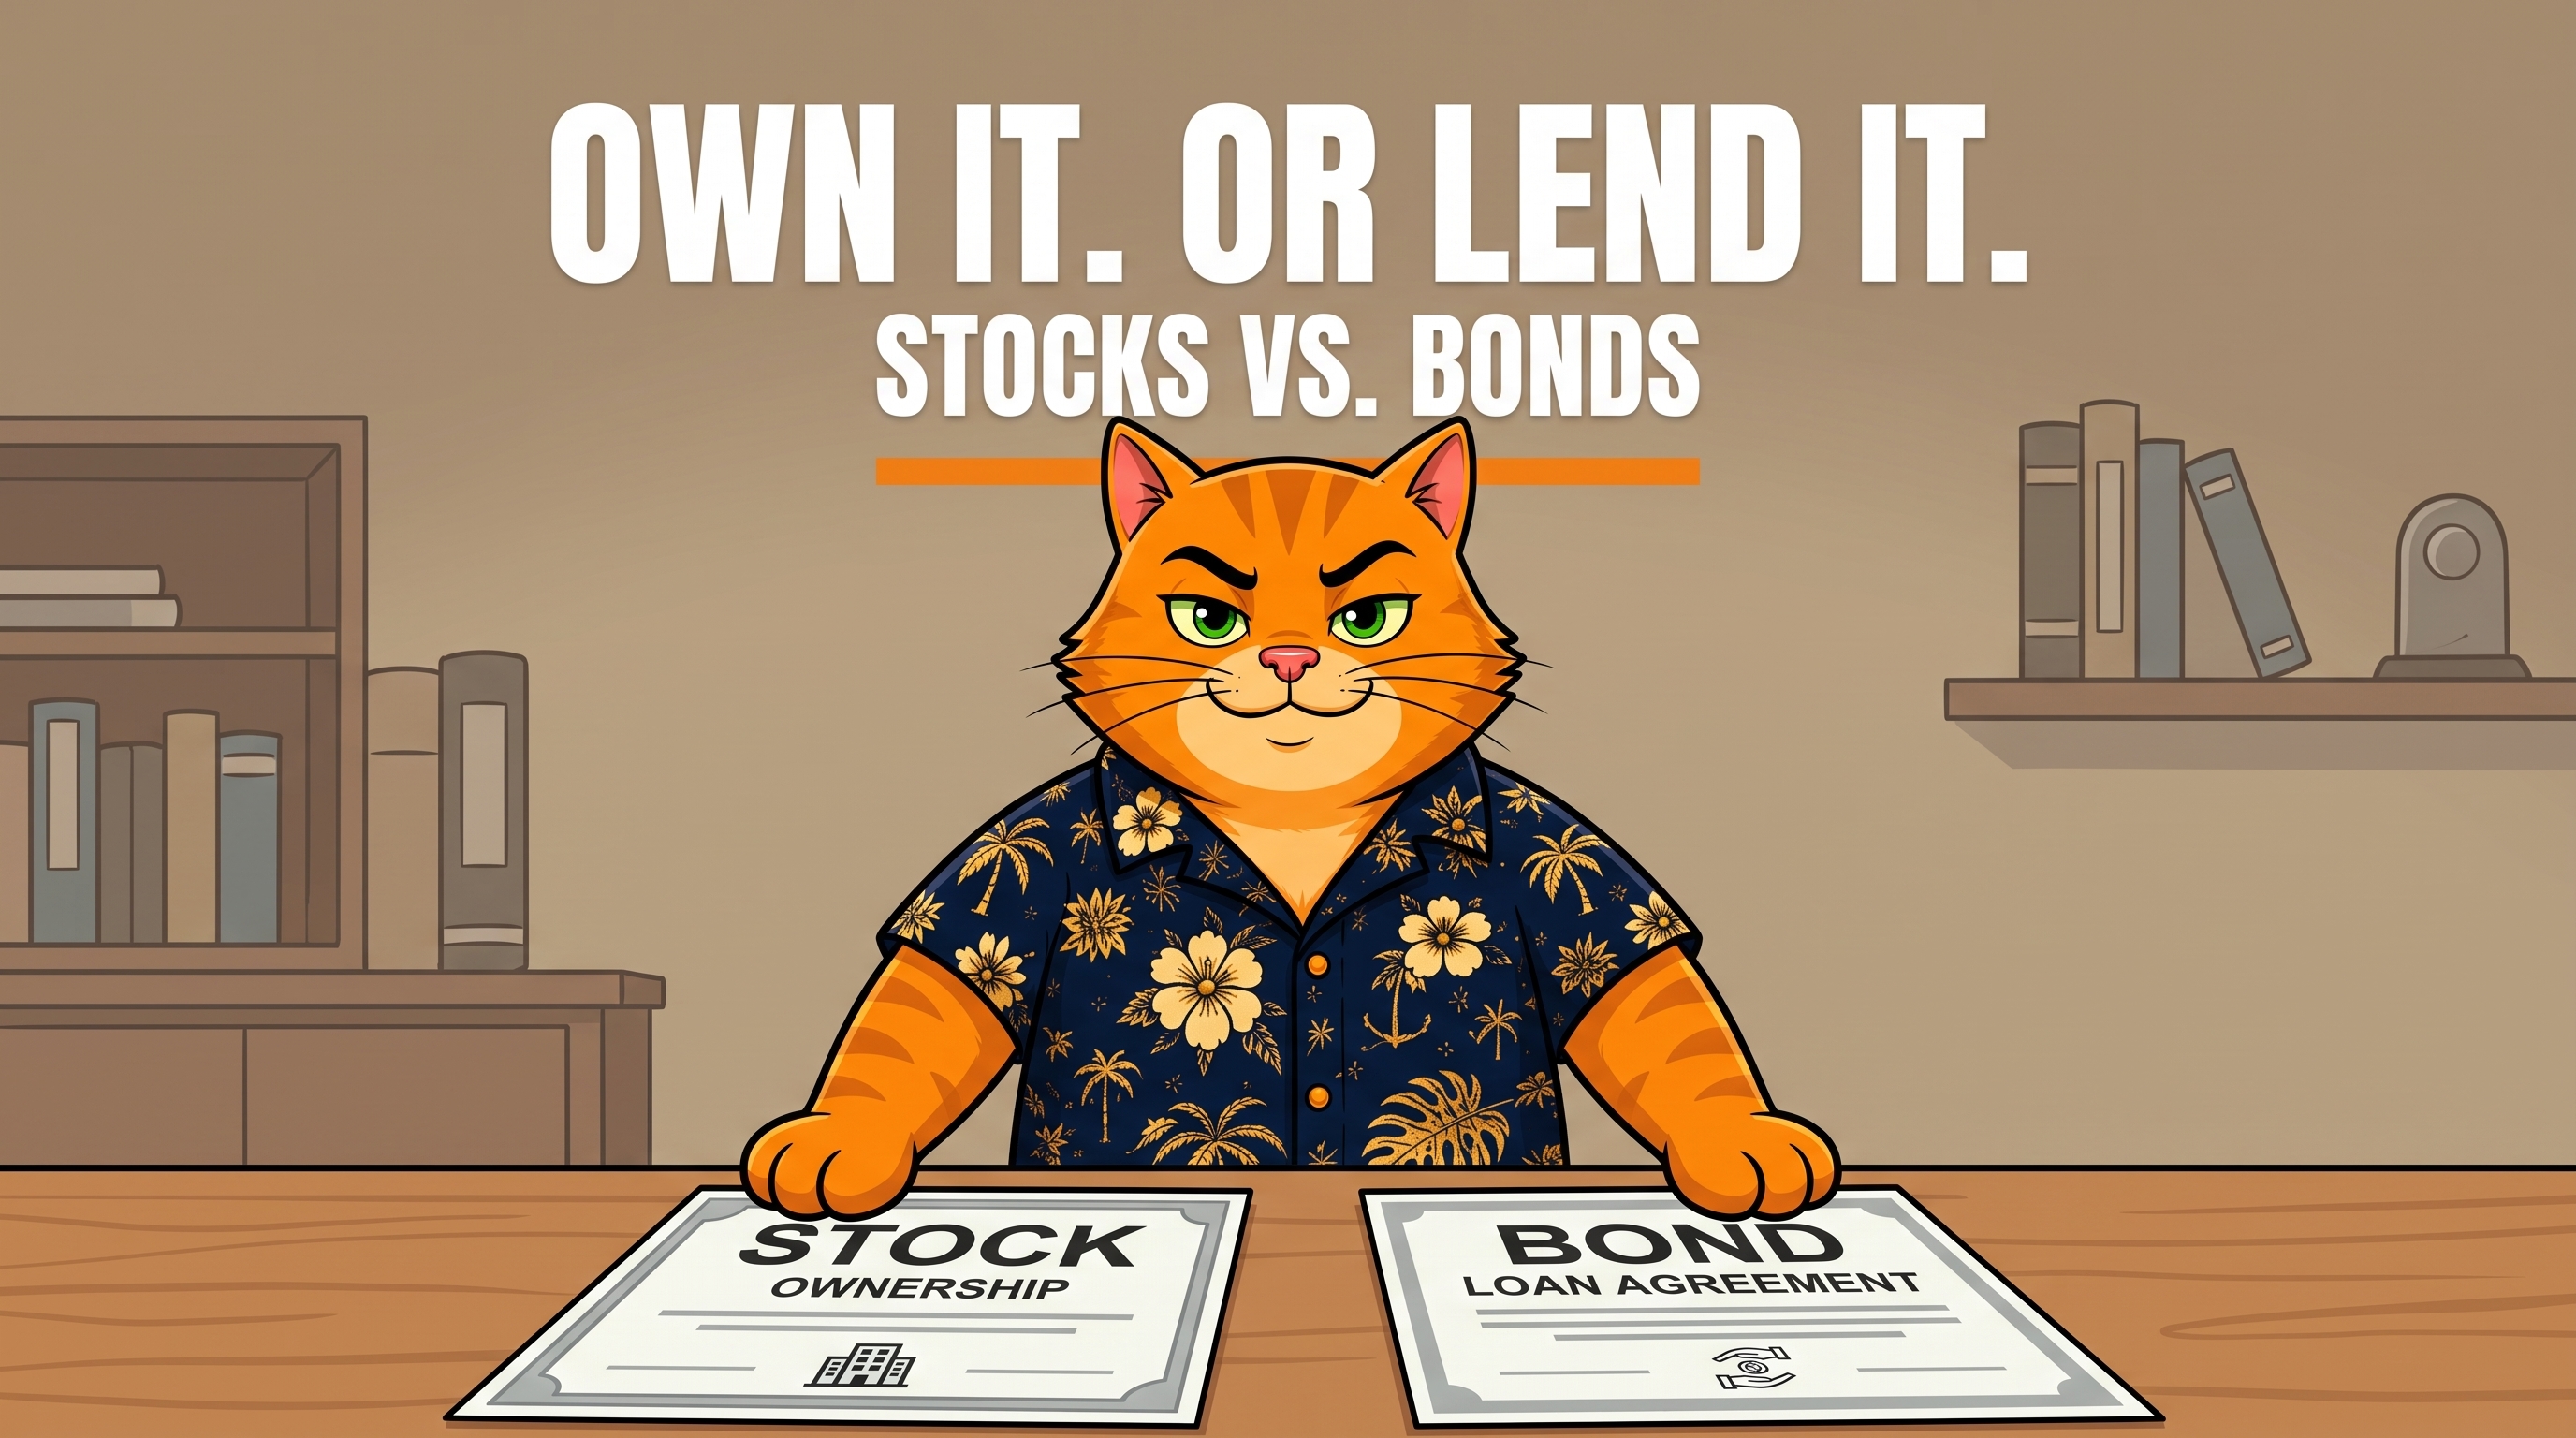
When you buy a stock, you're buying a small slice of a company. You become a part-owner. If the company grows and becomes more valuable, your slice becomes more valuable too. If it struggles, your slice loses value. You're not owed anything — no fixed payment, no promise you'll get your money back. You're along for the ride, good or bad.
When you buy a bond, you're not buying a piece of anything. You're loaning money — to a company, a city, or the federal government — and in exchange, they promise to pay you back on a set schedule, plus interest along the way. You're a creditor, not an owner. As long as the borrower doesn't default, you know roughly what you're going to get and when.
Own vs. lend. That's the split.
Julio's Portfolio, Over Time
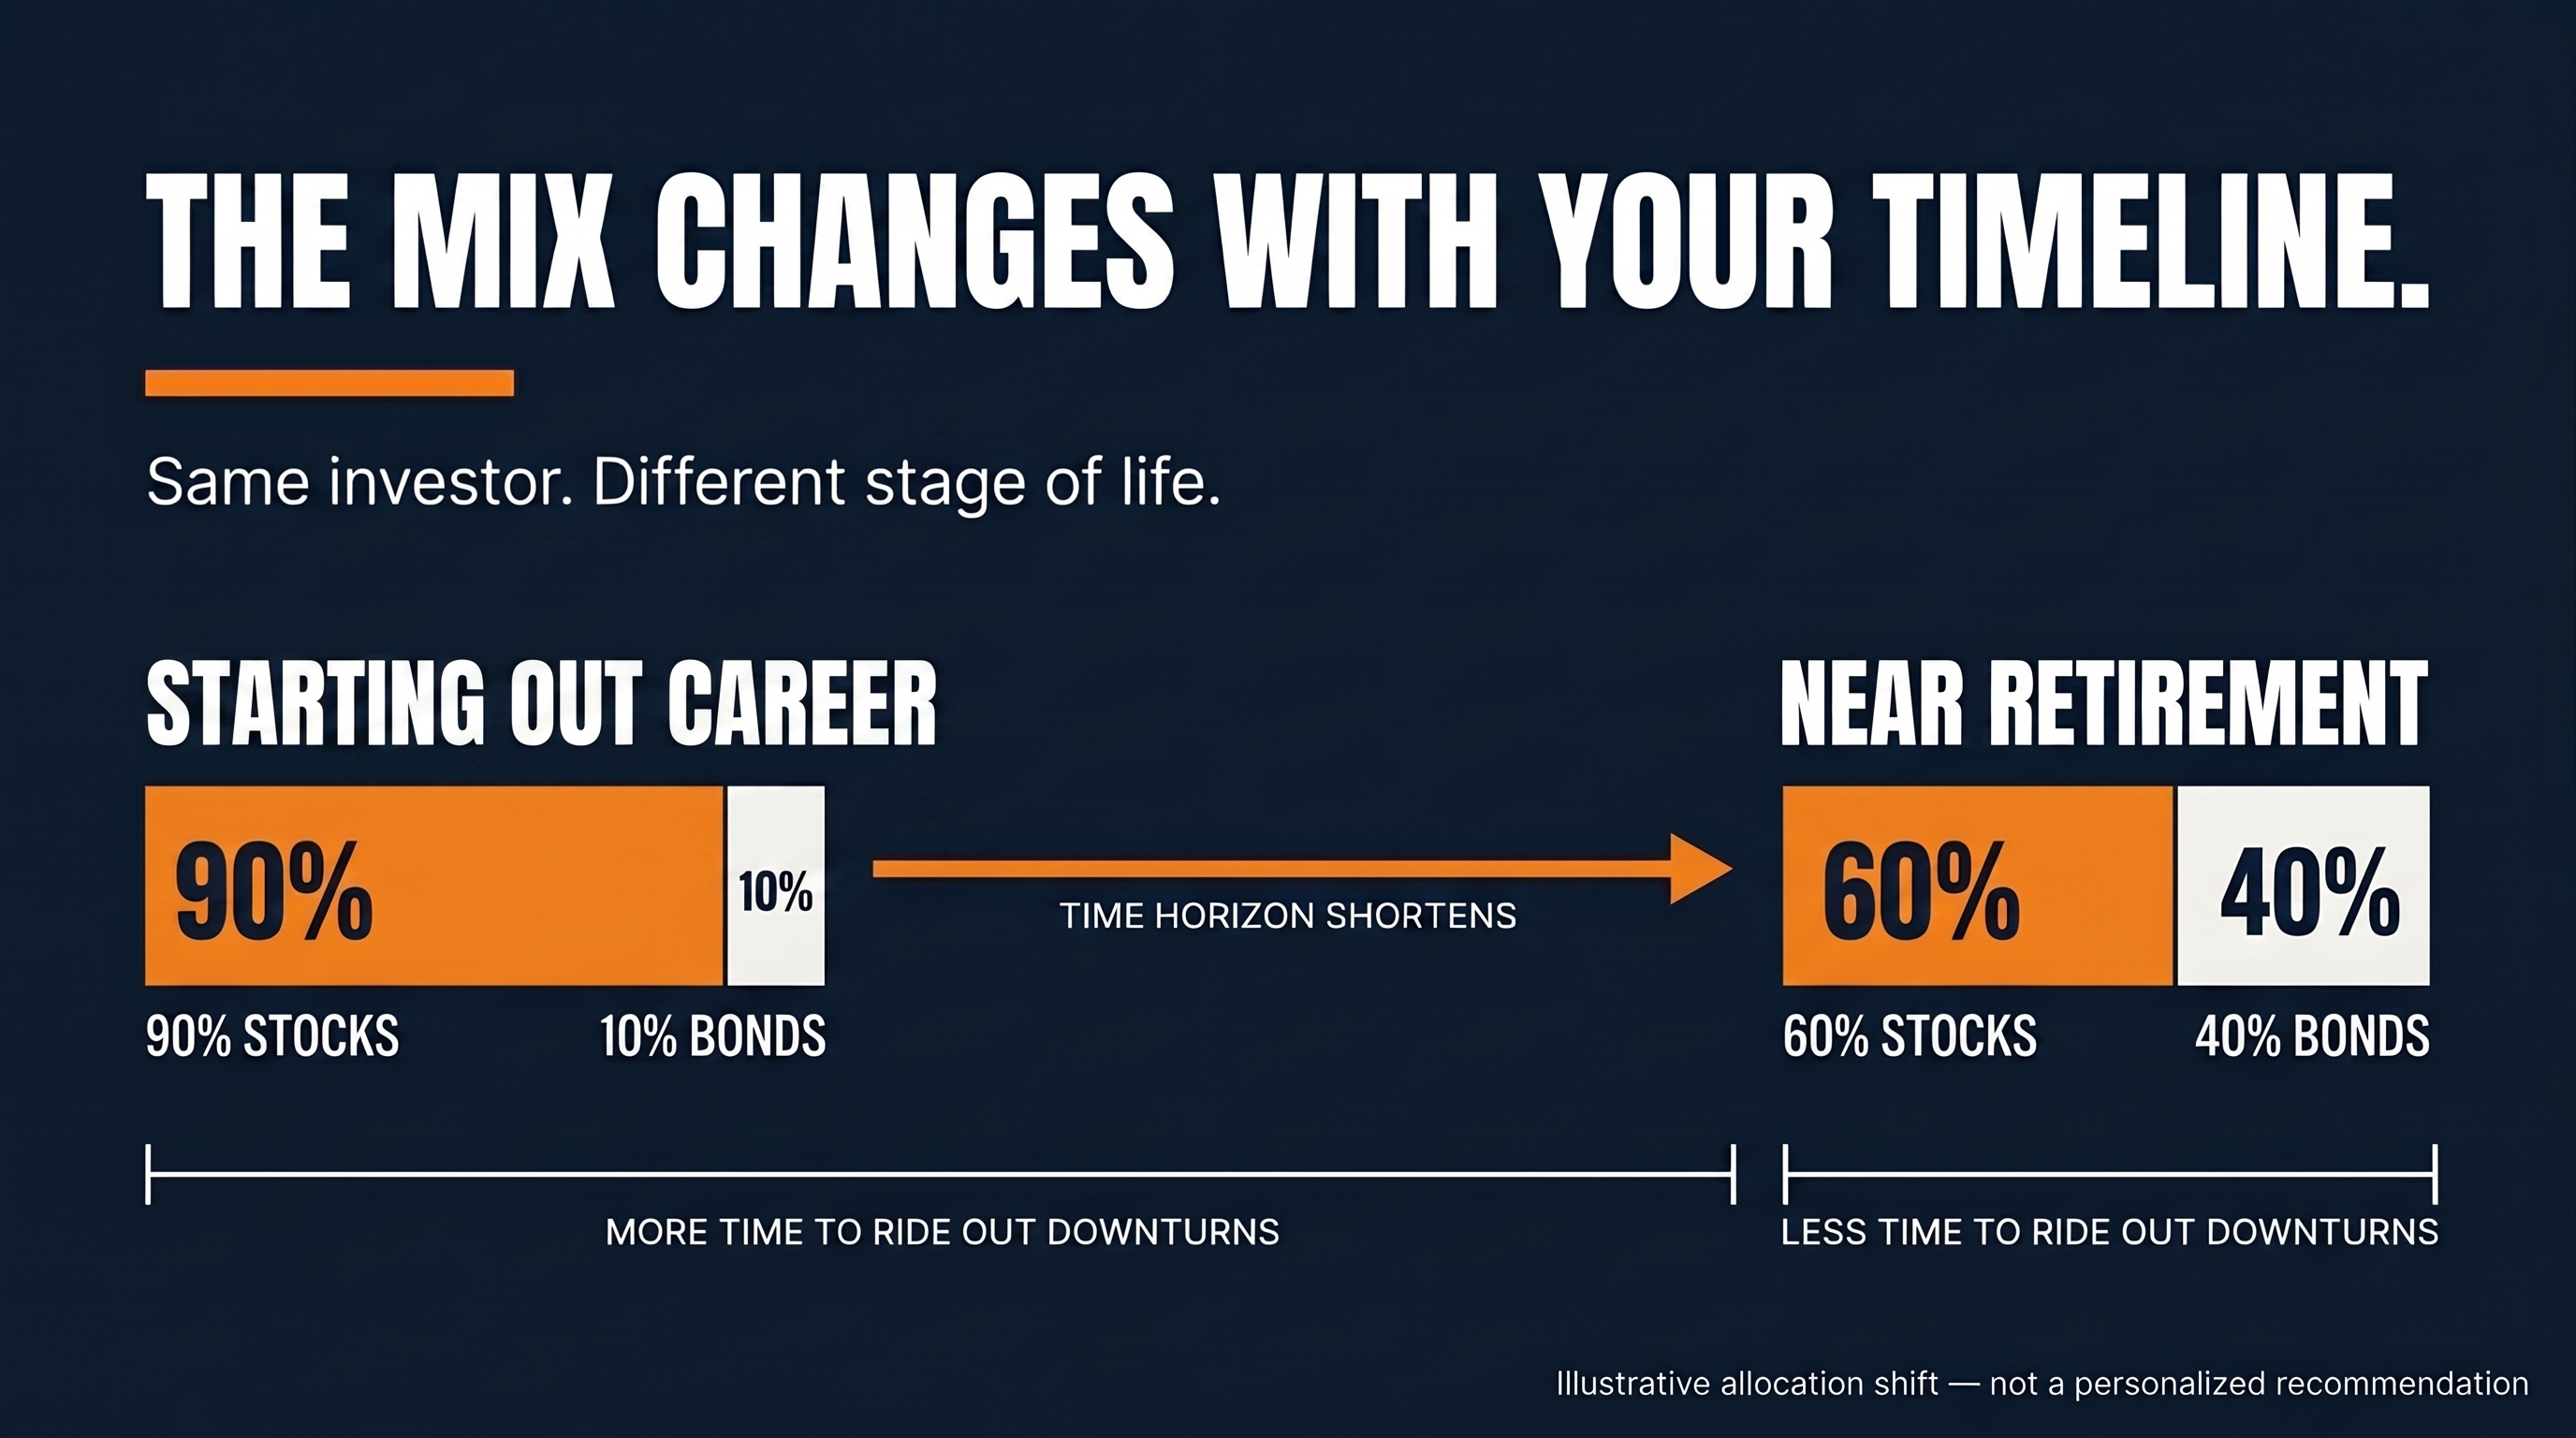
When Julio started his career and started investing, he put together a portfolio that's about 90% stocks and 10% bonds. That mix makes sense early on: he has lots of time before he'll need the money, so he can afford to ride out the ups and downs that come with owning companies. Time is what lets him recover from a bad stretch.
Near the end of Julio's career, a few years out from retirement, he switches to a more traditional 60% stocks, 40% bonds split. He hasn't lost his nerve; his timeline has just changed. He no longer has decades to wait out a downturn, and he's starting to care more about predictable income than maximum growth. Shifting some of his money from ownership (stocks) to lending (bonds) is how he dials down the volatility he can afford to take.
To see why that shift matters, it helps to look at what each asset has actually returned over long stretches of time. Broad U.S. stocks (the S&P 500) have averaged something in the neighborhood of 7% a year over the long run. Intermediate-term U.S. government bonds have averaged closer to 4-5% a year over similarly long stretches. That gap is the price of admission for stock ownership: a meaningfully higher long-run return, in exchange for a much bumpier ride and years where the number is deeply negative rather than just below average.
These are long-run historical averages, not a forecast — actual returns in any given year, or any given decade, can and do land far from the average in both directions.
There's also a difference in what "value" means for each. A bond's stated return is tied to its coupon: if you buy a bond paying 4% and hold it to maturity, you get that 4% — the bond's price can still move up or down in the meantime, but the return you were promised doesn't change just because the price does. A stock has no such promise attached. Its value is simply whatever the market is willing to pay for it right now, and that number moves constantly. If you buy a stock at $50 and it's trading at $65, your position is worth more; if it drops to $40, it's worth less — there's no coupon underneath holding it steady. That's the practical difference between lending and owning: a bondholder's return is fixed unless the borrower defaults, while a stockholder's return is just whatever the price happens to be when they look.
Risk and Return
Stocks: higher potential return over the long run, but no guarantee — and real volatility along the way. A company's value can drop sharply, and there's no promise it comes back.
Bonds: generally lower potential return, and more predictable — but not risk-free. Two risks matter most:
- Default risk — the borrower fails to pay you back.
- Interest rate risk — the value of your bond moves based on what's happening with interest rates elsewhere in the market.
What Is a Bond Yield Curve
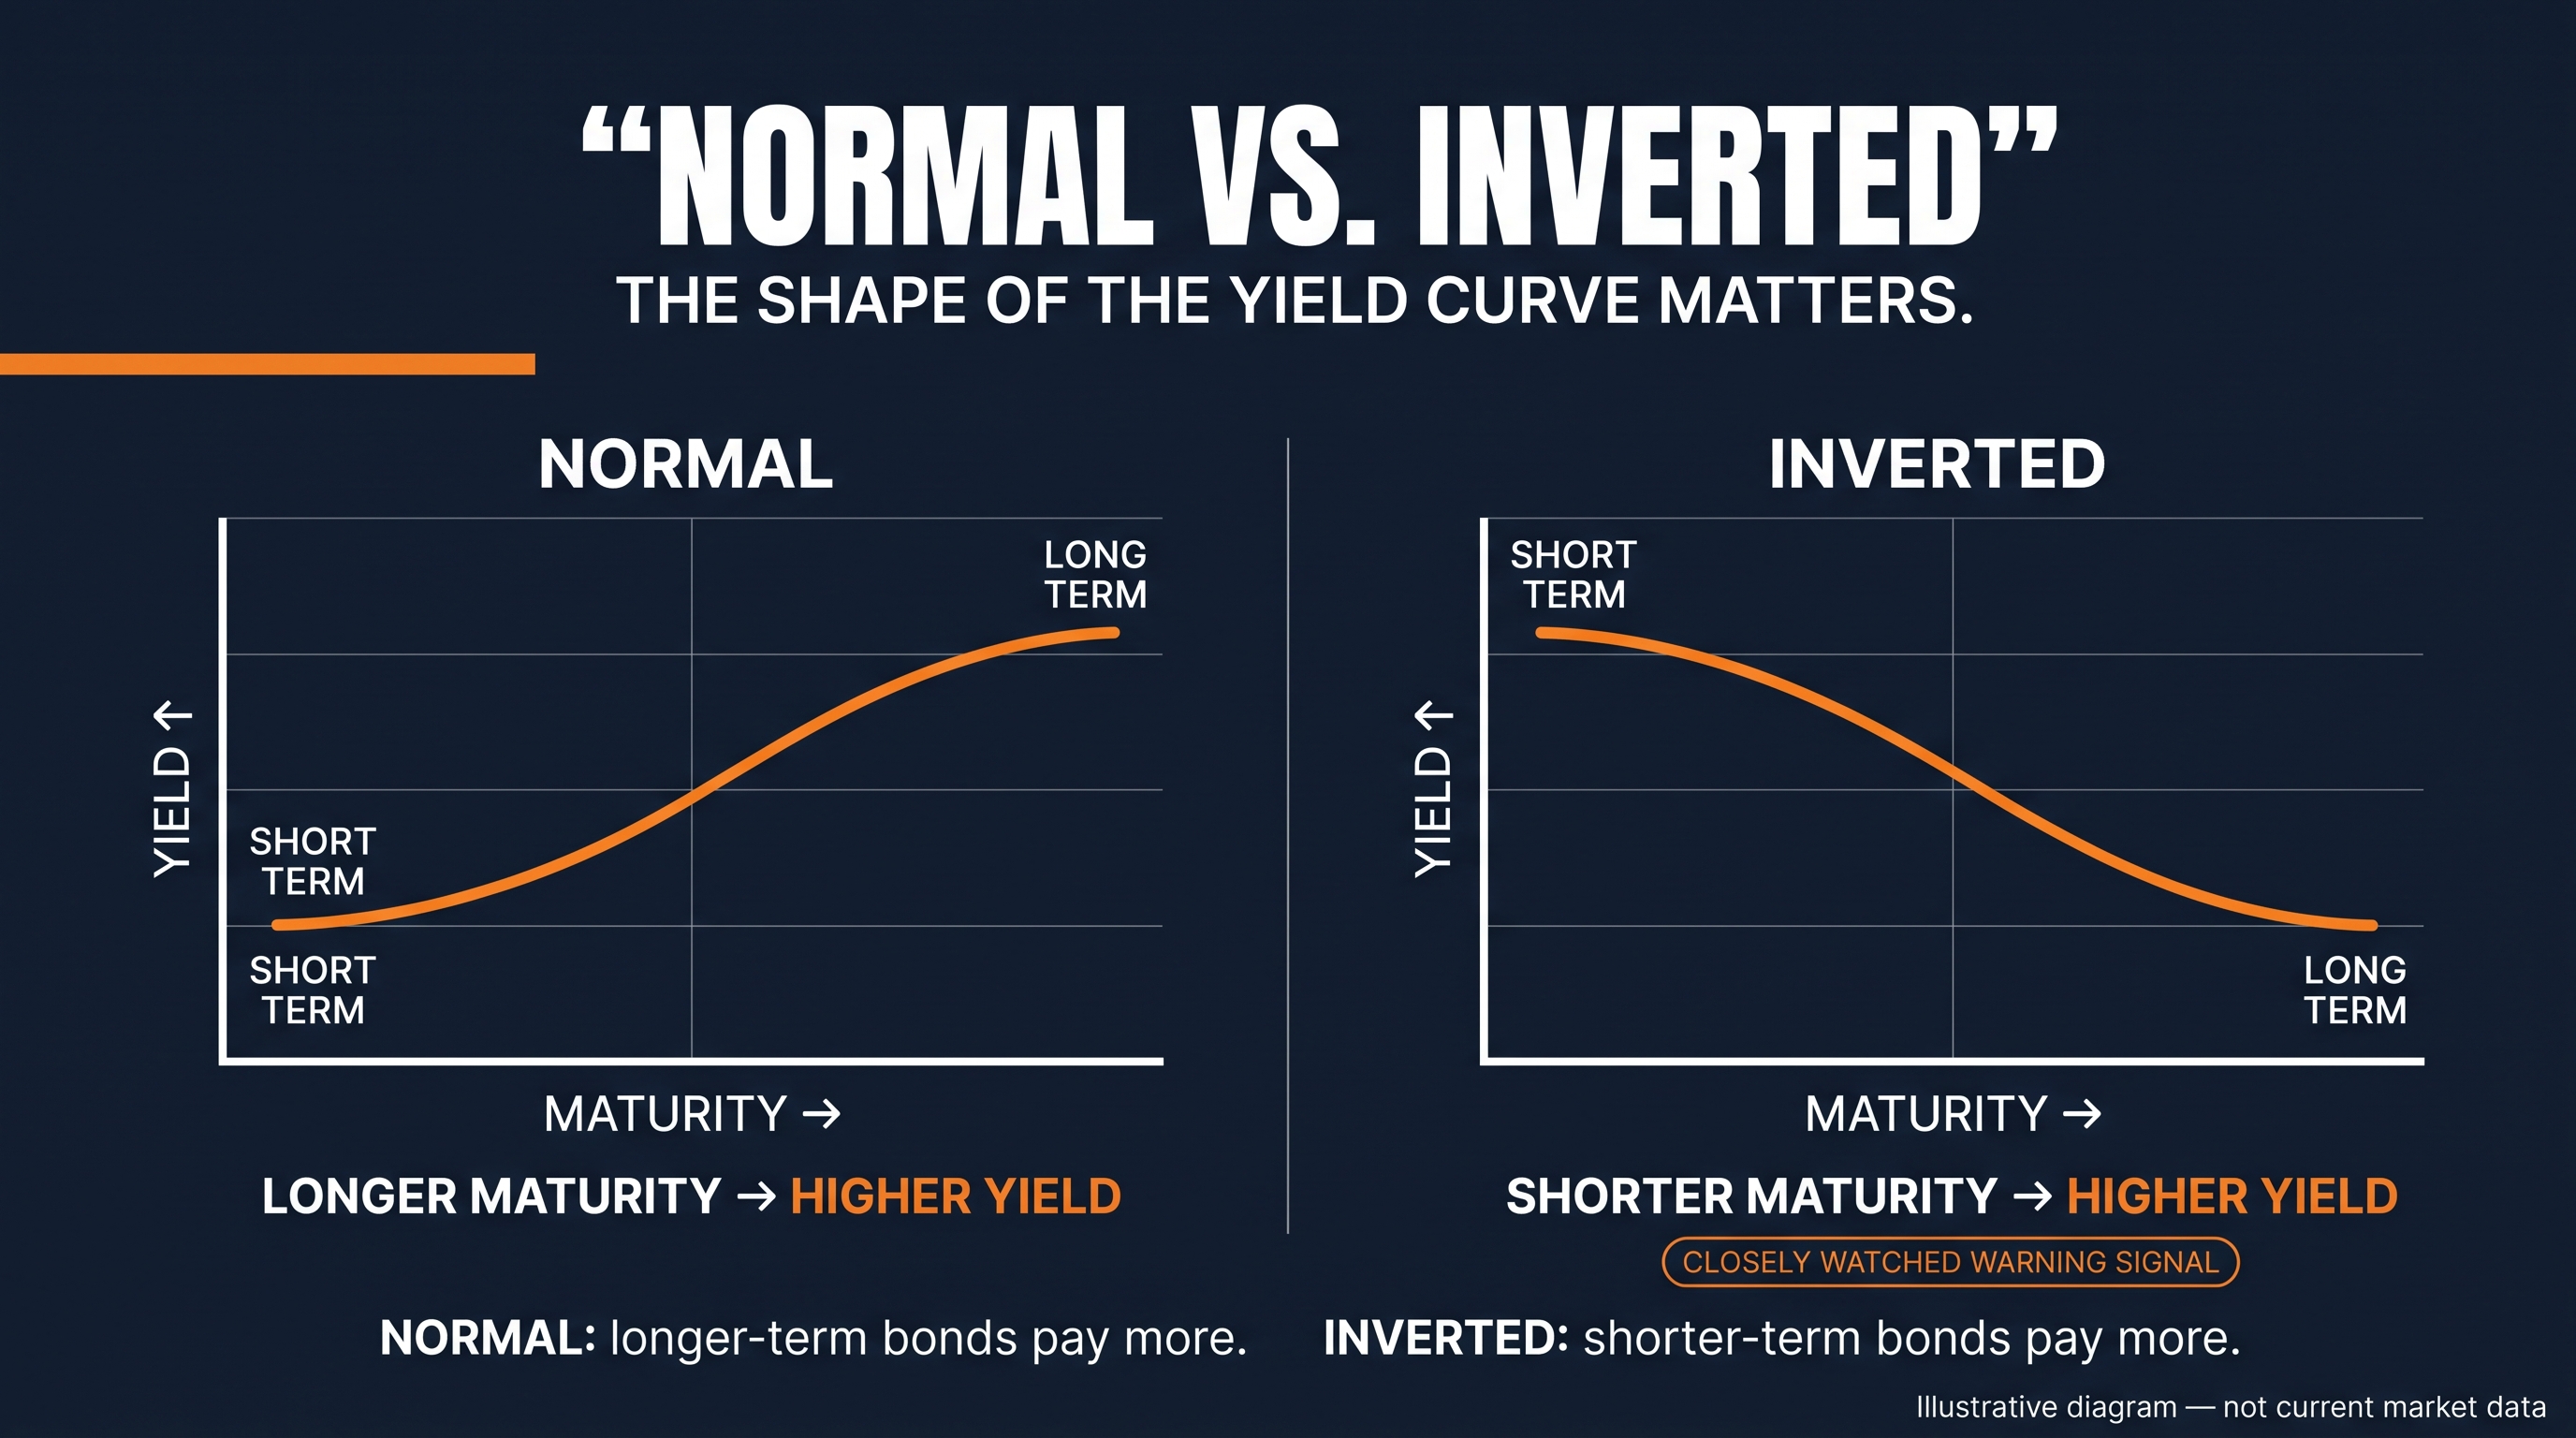
The yield curve is just a chart of interest rates across bonds with different maturities — how much a 3-month Treasury bill pays versus a 2-year note versus a 10-year bond, and so on.
In a normal yield curve, longer-term bonds pay more than shorter-term ones. That makes intuitive sense: if you're tying up your money for 10 years instead of 3 months, you'd want to be paid more for the extra time and uncertainty. A normal, upward-sloping curve generally reflects a stable, expanding economy.
An inverted yield curve is the reverse: short-term bonds pay more than long-term ones. It's unusual, and it happens when investors expect rates — and the economy — to weaken down the road. Because of that, an inverted curve is closely watched as a possible early signal of a slowing economy or recession, though it's not a guarantee one is coming.
How the Yield Curve Affects Bondholders
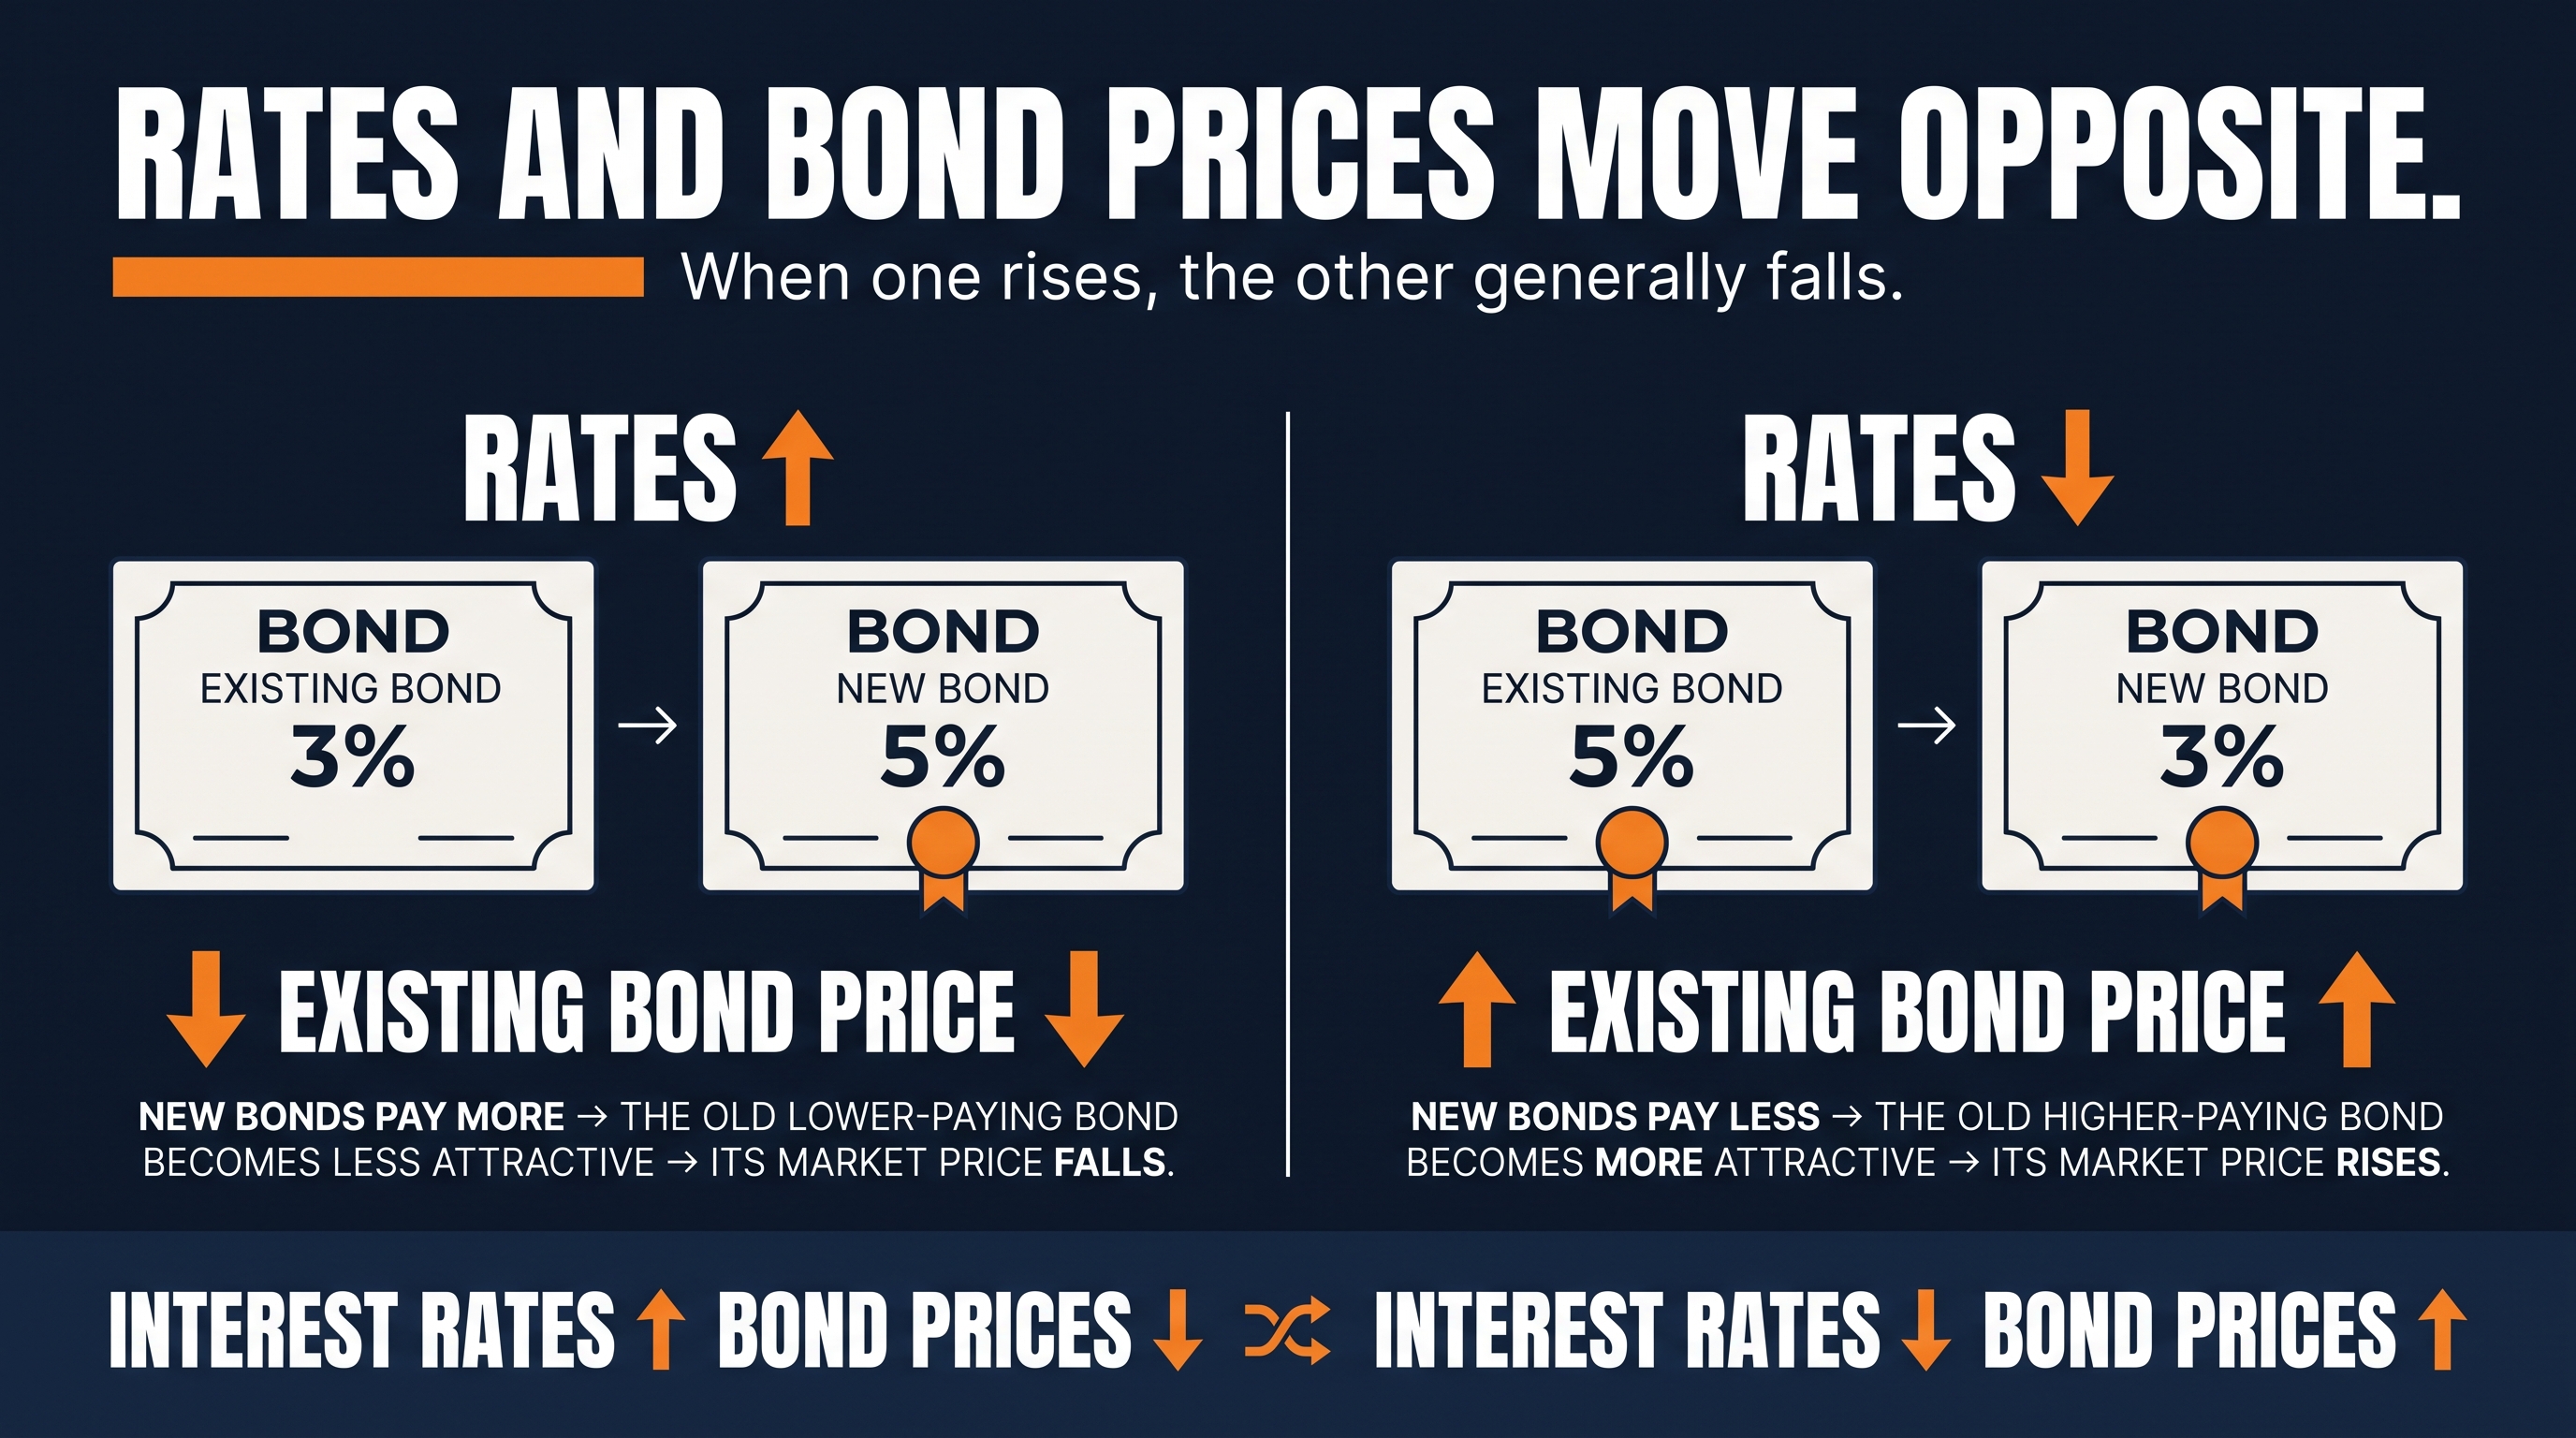
Here's the mechanic that trips people up: when interest rates rise, the price of existing bonds falls. When rates fall, existing bond prices rise.
Why? If you're holding a bond that pays 3% and new bonds start being issued at 5%, nobody wants to pay full price for your lower-paying bond anymore — so its price drops to make it competitive. The reverse happens when rates fall and your old bond suddenly looks generous by comparison.
This is exactly why Julio's shift toward more bonds near retirement isn't automatically "safe" in every sense. Bonds are more predictable than stocks, but they're not immune to price swings — it's worth understanding this mechanic before assuming a bond-heavy portfolio can't lose value in the short term.
A Common Mix-Up
Bonds are lower-risk. They are not zero-risk. Between default risk and interest rate risk, a bond portfolio can still lose value — just usually less dramatically, and less often, than a stock portfolio.
Check Your Own Mix
Take a look at your portfolio or your 401(k) allocation. Where does it sit on the stocks-to-bonds spectrum, and where are you on your own timeline. There's no universal right answer, but the logic behind why the mix shifts is the same for everyone: how much time do you have to ride out a downturn, and how much do you need predictability instead?
Sources: