What Compound Interest Actually Is
Compound interest is interest earned on both your original money and the interest it has already earned. In investing, a similar compounding effect happens when returns remain invested and can generate additional returns over time.
Worth being precise about what kind of account you're in, since the two work differently. A savings account — a high-yield savings account is a good example — can literally pay a stated compound interest rate: a set Annual Percentage Yield (APY), applied to your balance, compounding on a schedule the bank defines. An investment account doesn't work that way. It produces variable returns that may themselves generate further returns over time, but there's no guaranteed rate — some years are strong, some are flat, some are negative. Both are genuinely compounding. Neither works identically to the other, and an investment should never be described as paying a guaranteed compound interest rate.
The Model
For illustration, we'll model an average 7% annual return. Real investment returns don't arrive as a steady 7% each year — some years are higher, some lower, and some are negative. This model smooths that out on purpose, because the point isn't to predict any specific year. It's to make the compounding mechanism itself visible.
The model: $300 contributed at the start of every month, growing at an illustrative average 7% annual return, starting from $0. Every figure below comes from that exact model, calculated month by month.
Cory: Five Years In
Cory has been contributing $300 a month for five years under this model. Here's where that stands:
- Contributed so far: $18,000
- Balance: $21,603
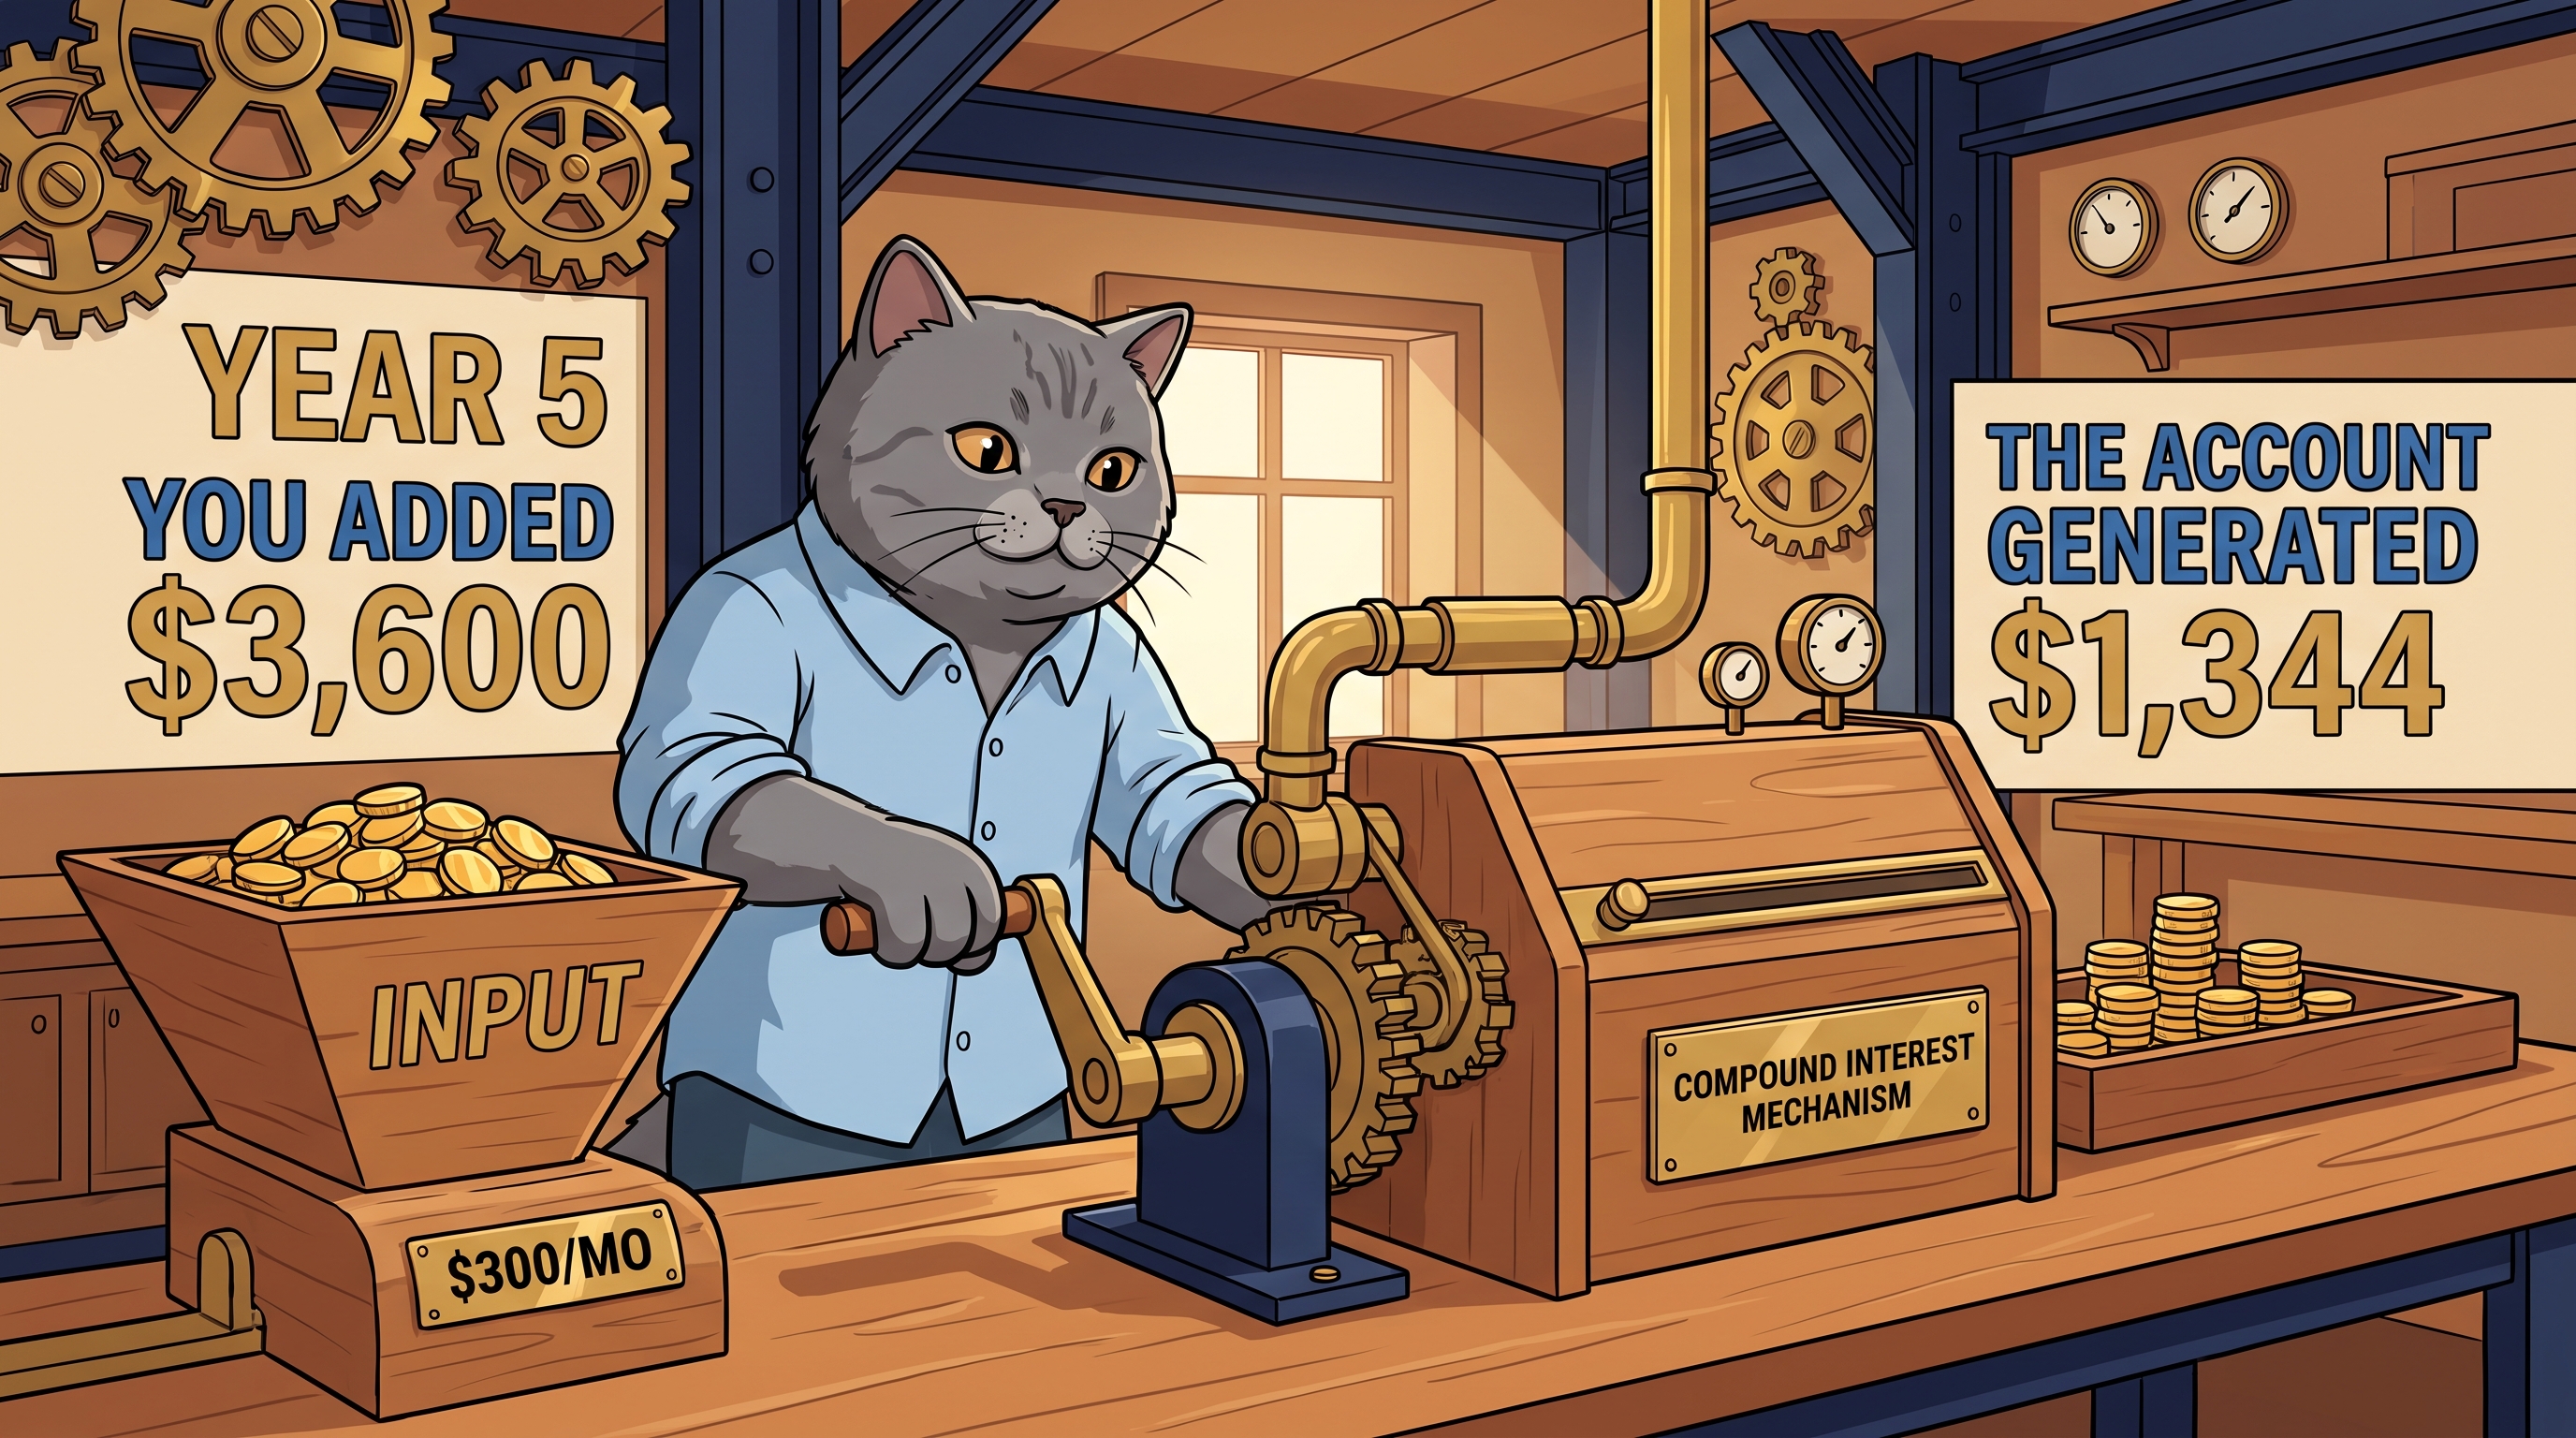
- Contributed during Year 5 alone: $3,600
- Growth generated during Year 5 alone: $1,344
That's a 0.37x ratio of growth to contributions for the year. Cory is still clearly the engine here. The account is growing, but Cory's own $300-a-month habit is what's driving most of the annual increase.
The Crossover
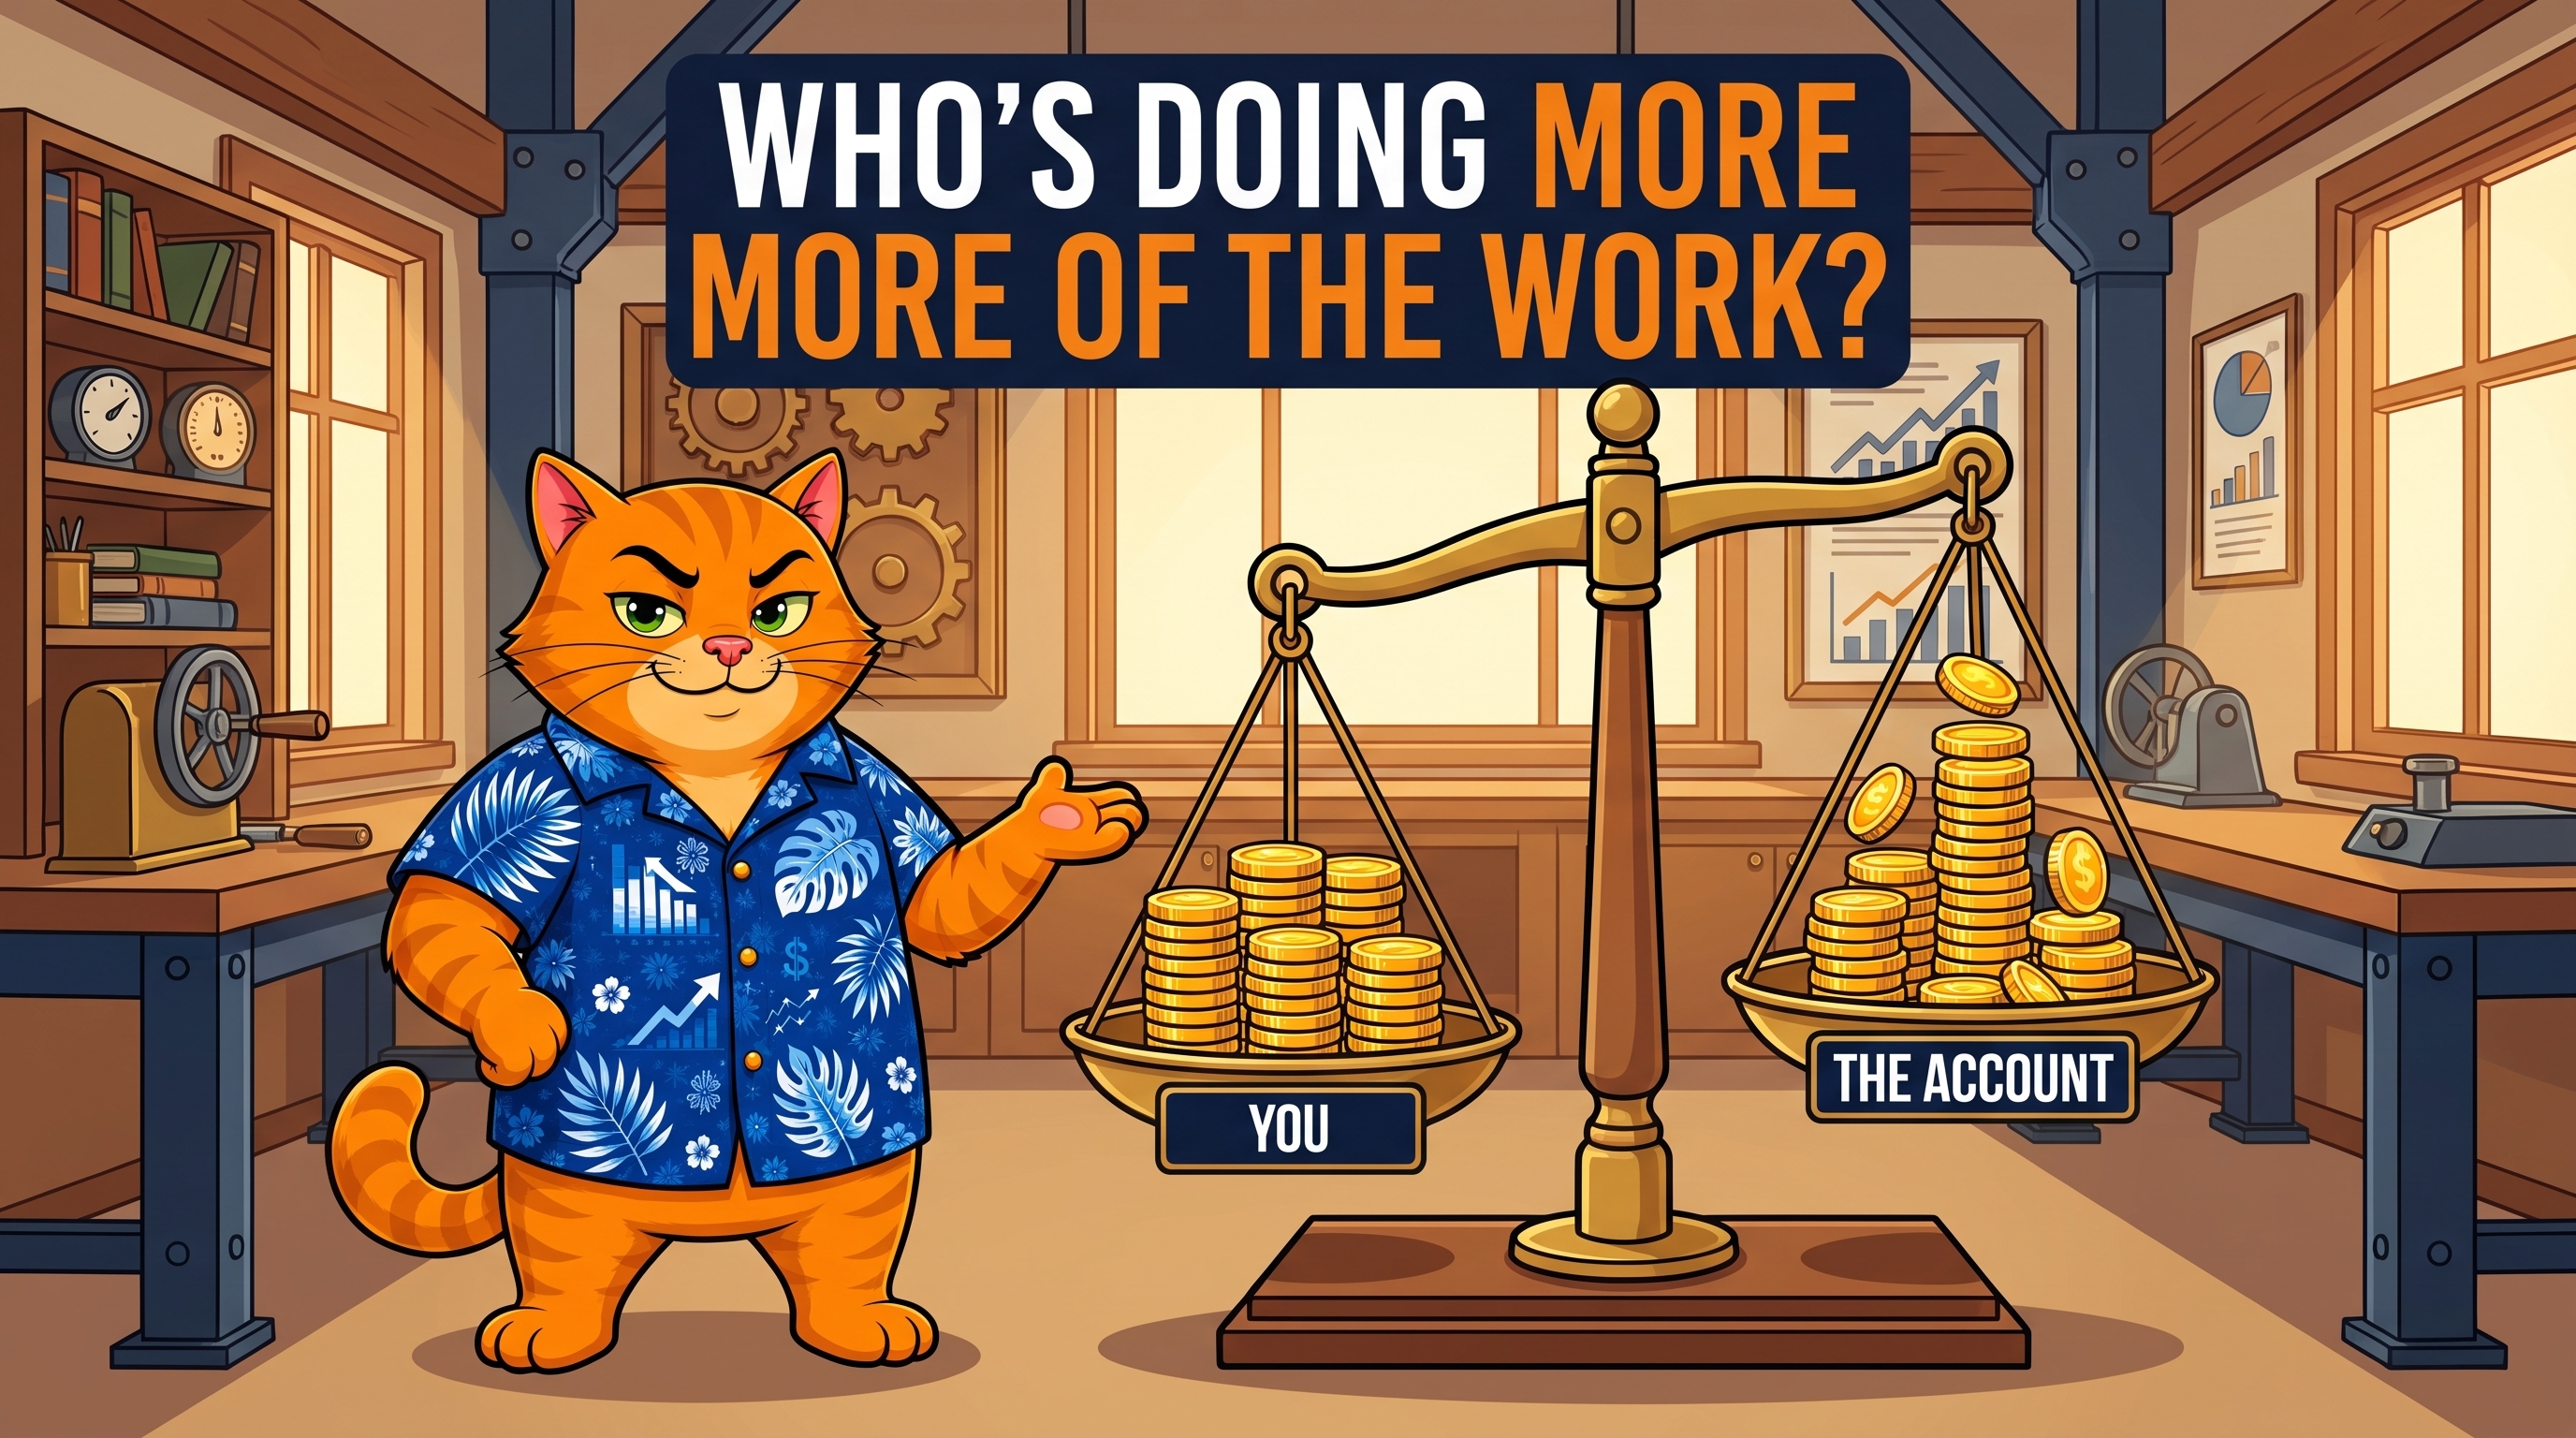
Here's the moment this whole post exists to show. By Year 10, the gap has narrowed — $3,408 in modeled growth against $3,600 contributed that year, a 0.95x ratio. Close. Not there yet.
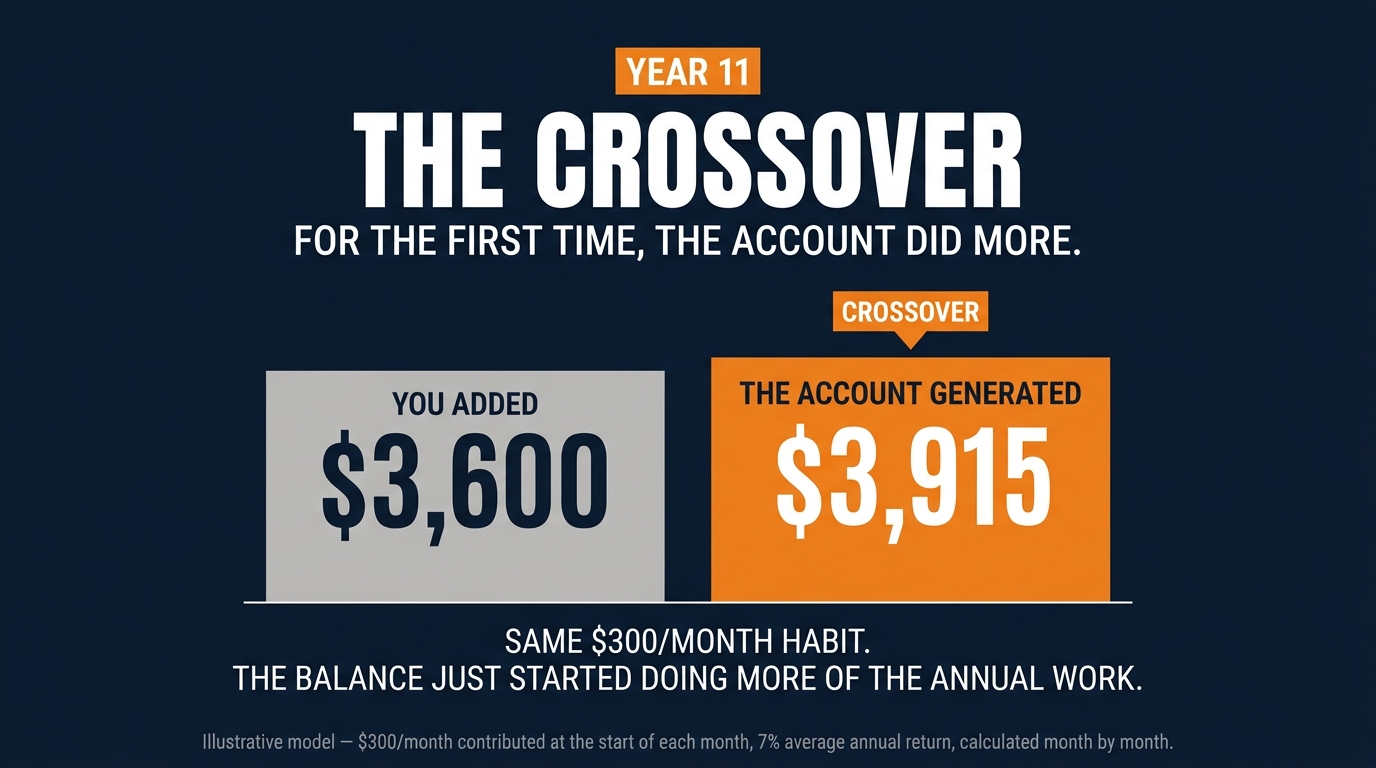
By Year 11, it flips. That year, the same $300-a-month contribution adds up to $3,600 — and the account itself generates $3,915 in growth. For the first time, the balance produces more growth in a year than the saver puts in during that year. Same habit. Same $300 a month. For the first time, the accumulated balance generated more growth than the new contributions added that year.
The Crossover
Year 11: $3,600 contributed vs. $3,915 generated by the account
Modeled at $300 a month and an illustrative 7% average annual return, that's the first year the accumulated balance generates more growth than the new money going in.
One more milestone worth naming, at lower weight than the one above: by Year 18, something different crosses over. Total contributions since the beginning stand at $64,800. Total growth generated since the beginning stands at $65,170 — for the first time, everything the account has ever earned outweighs everything that's ever been put into it. That's a real milestone, but it's a different measurement than the Year 11 crossover — one is about a single year, this one is about the whole journey to date. Worth knowing both exist. Worth not mixing them up.
Mason: Twenty Years In
Mason has been running the exact same $300-a-month habit, under the same modeled assumptions, for twenty years. Here's where that stands:
- Contributed so far: $72,000
- Balance: $157,190
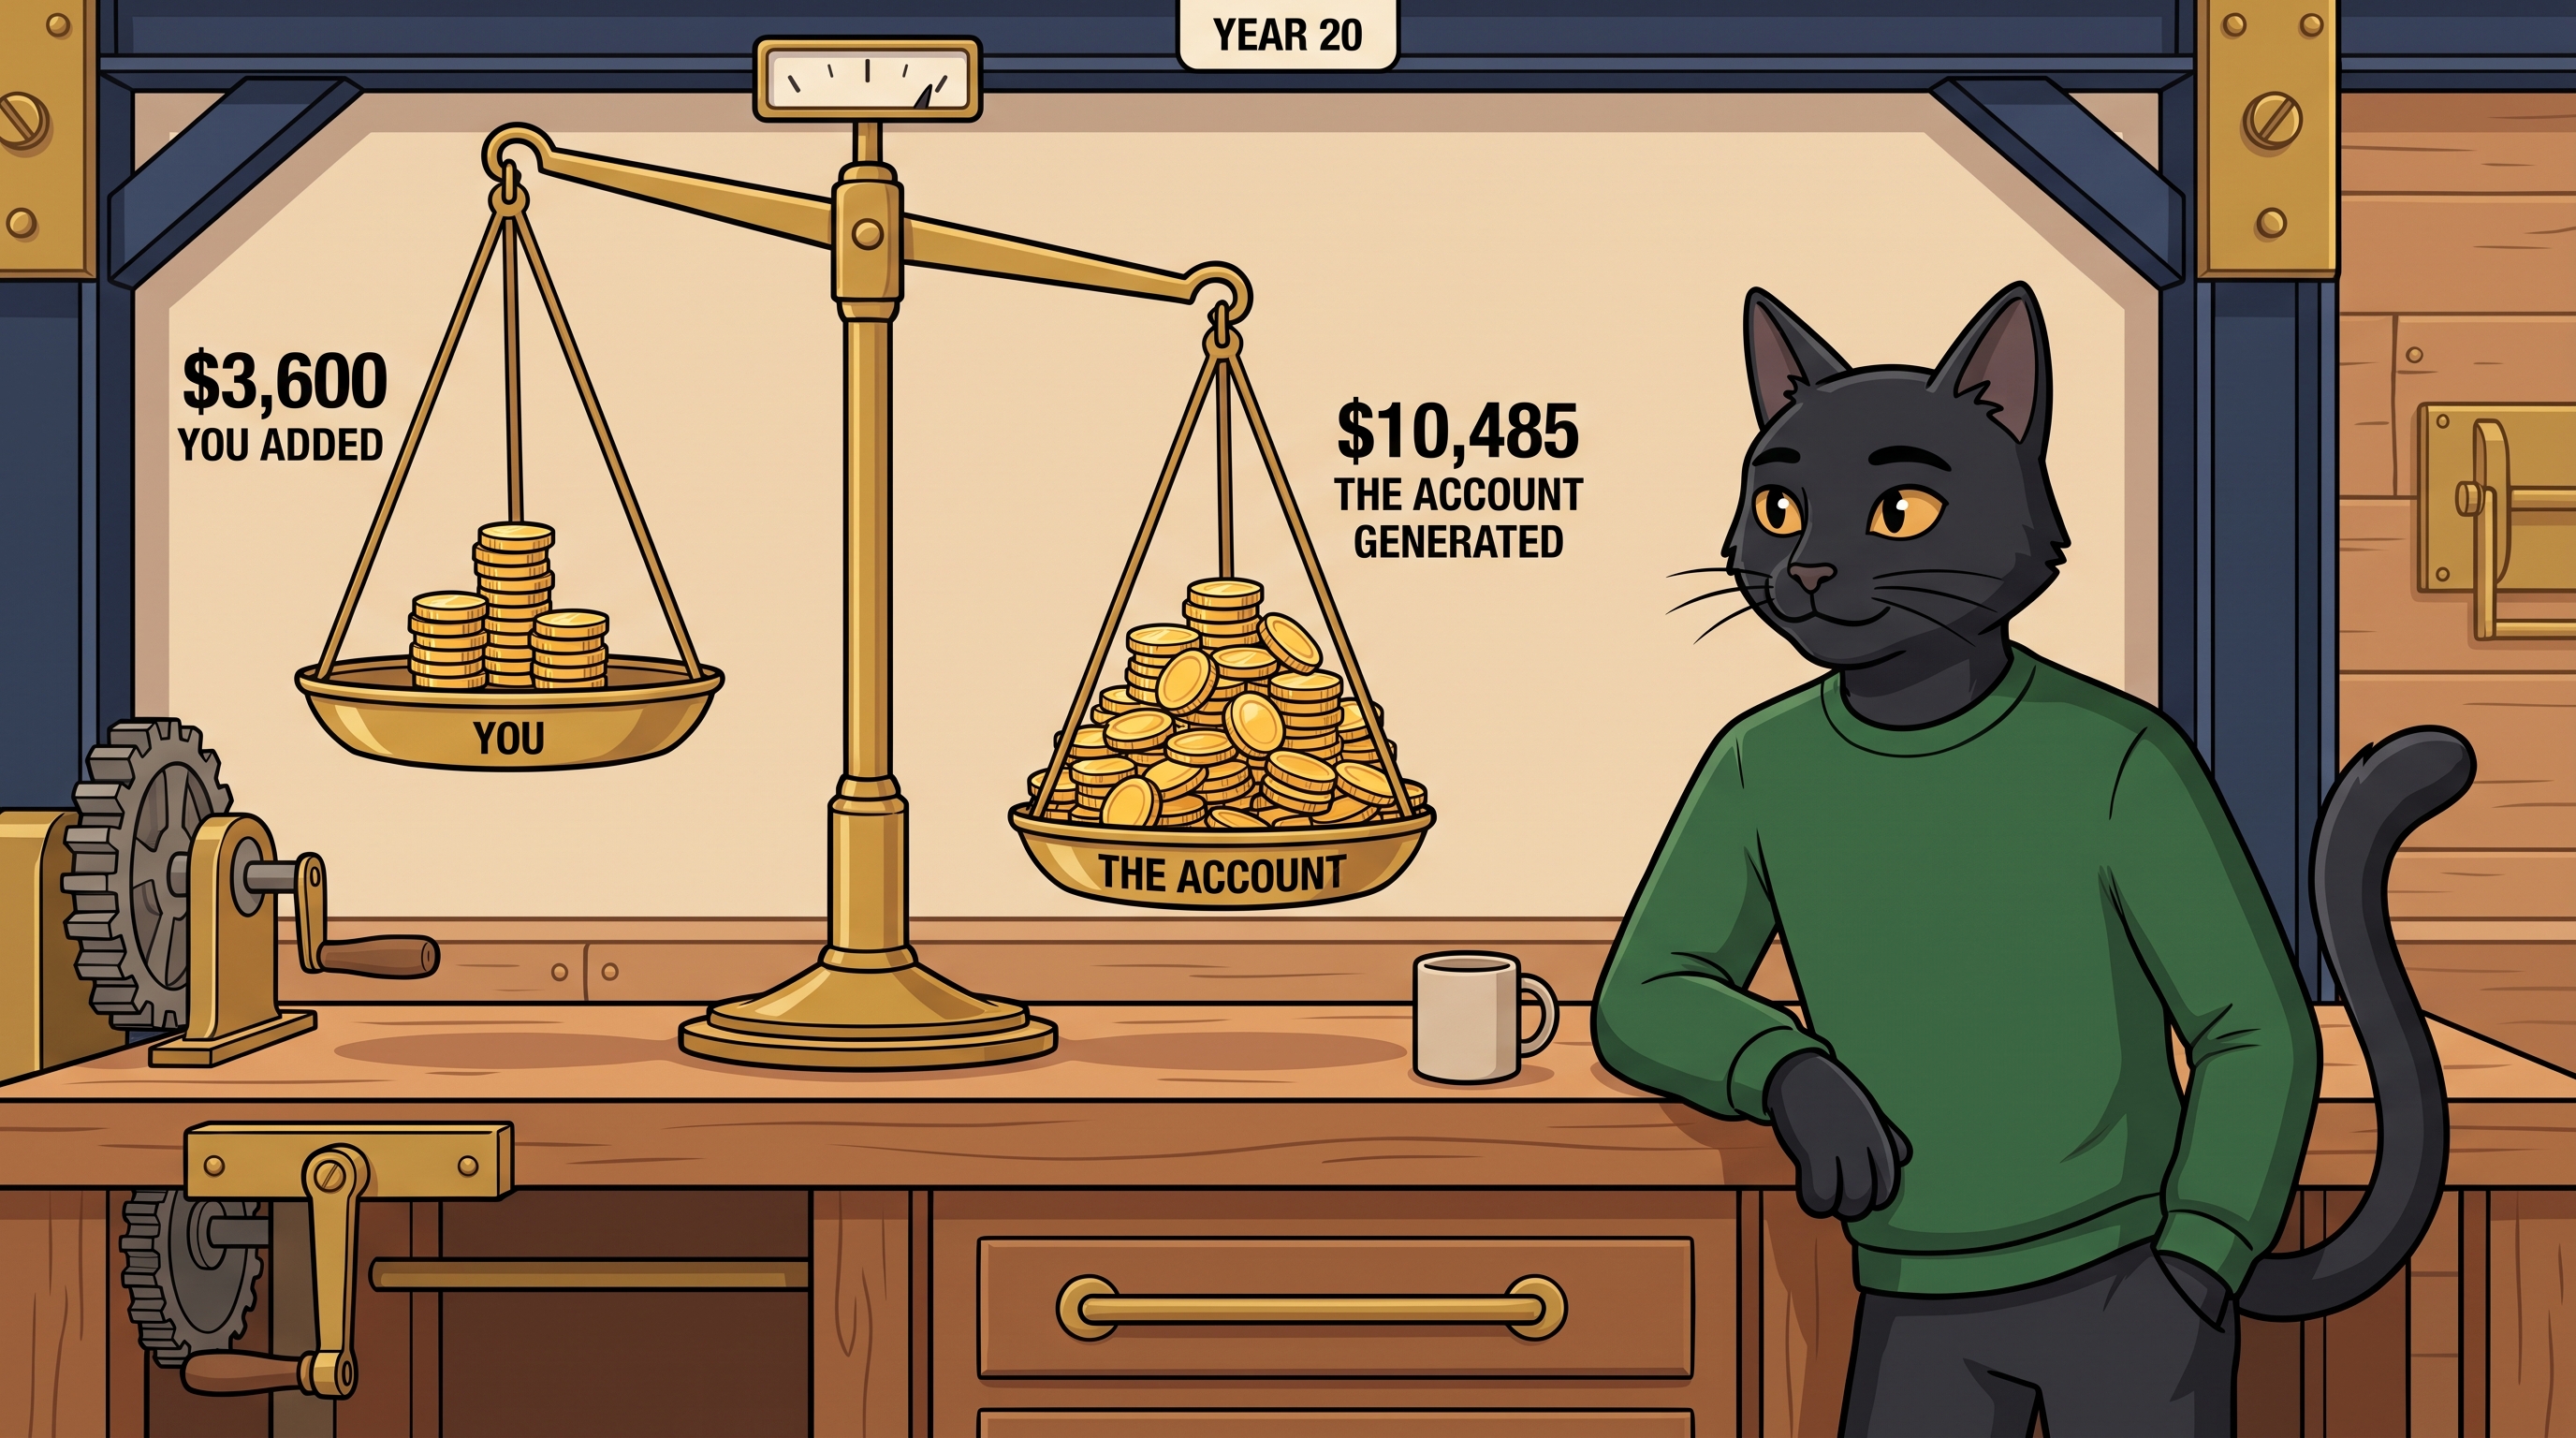
- Contributed during Year 20 alone: $3,600
- Growth generated during Year 20 alone: $10,485
That's a 2.91x ratio. Mason didn't change the habit. Mason didn't contribute more. Time, and the larger balance that time built, changed how much of the annual increase came from new contributions versus growth generated by the accumulated balance. Keep going another ten years under the same model, and by Year 30 that ratio reaches 6.86x — $24,705 in modeled annual growth against the same $3,600 contributed.
The Real World Isn't This Smooth
Everything above uses a smooth, illustrative 7% average to make the mechanism visible. Real investing doesn't move in a straight line — some years are strong, some are flat, some lose money. What actually lets compounding do its work over decades isn't a steady annual return; it's staying invested through that unevenness, so whatever growth does happen keeps operating on top of an accumulated base instead of getting interrupted. This isn't a post about picking investments or timing the market — it's about understanding the mechanism that a real, uneven sequence of returns is still running underneath.
Compounding Works Both Ways
Compounding can work against you, too. Debt can accumulate interest on top of an existing balance, causing the amount owed to grow over time. Credit cards have their own interest-calculation rules, which can vary by issuer and card agreement. How Does Credit Card Interest Work? walks through that math in real dollars.
The Part Chuck Wants You To Actually Do
You don't control what the market returns in any given year. You do control whether you keep contributing and how long you give the money to compound. Cory and Mason are doing the same thing in this model. The difference is simply how long that $300-a-month habit has been running. If you haven't checked where your own money is actually compounding — a retirement account, a savings account, anywhere it sits — that's worth five minutes this week, before assuming the account is on autopilot.
Same $300 a month, both of them. Time did the rest.

Chuck Finance is for entertainment and informational purposes only. Chuck is not a licensed financial advisor, and nothing in this post constitutes professional financial, investment, legal, or tax advice. The 7% return used in the examples above is an illustrative average, not a prediction — past performance does not guarantee future results, and actual investment returns vary and may be negative in any given year. Consult a licensed professional for your specific situation.
Sources
Figures in this post are calculated from a locked illustrative model ($300/month contribution at the start of each month, 7% average annual return compounded monthly, starting balance $0), independently verified month-by-month rather than approximated. This is a mathematical illustration, not a market statistic requiring a primary source citation.