Retirement savings by age: where the rule comes from
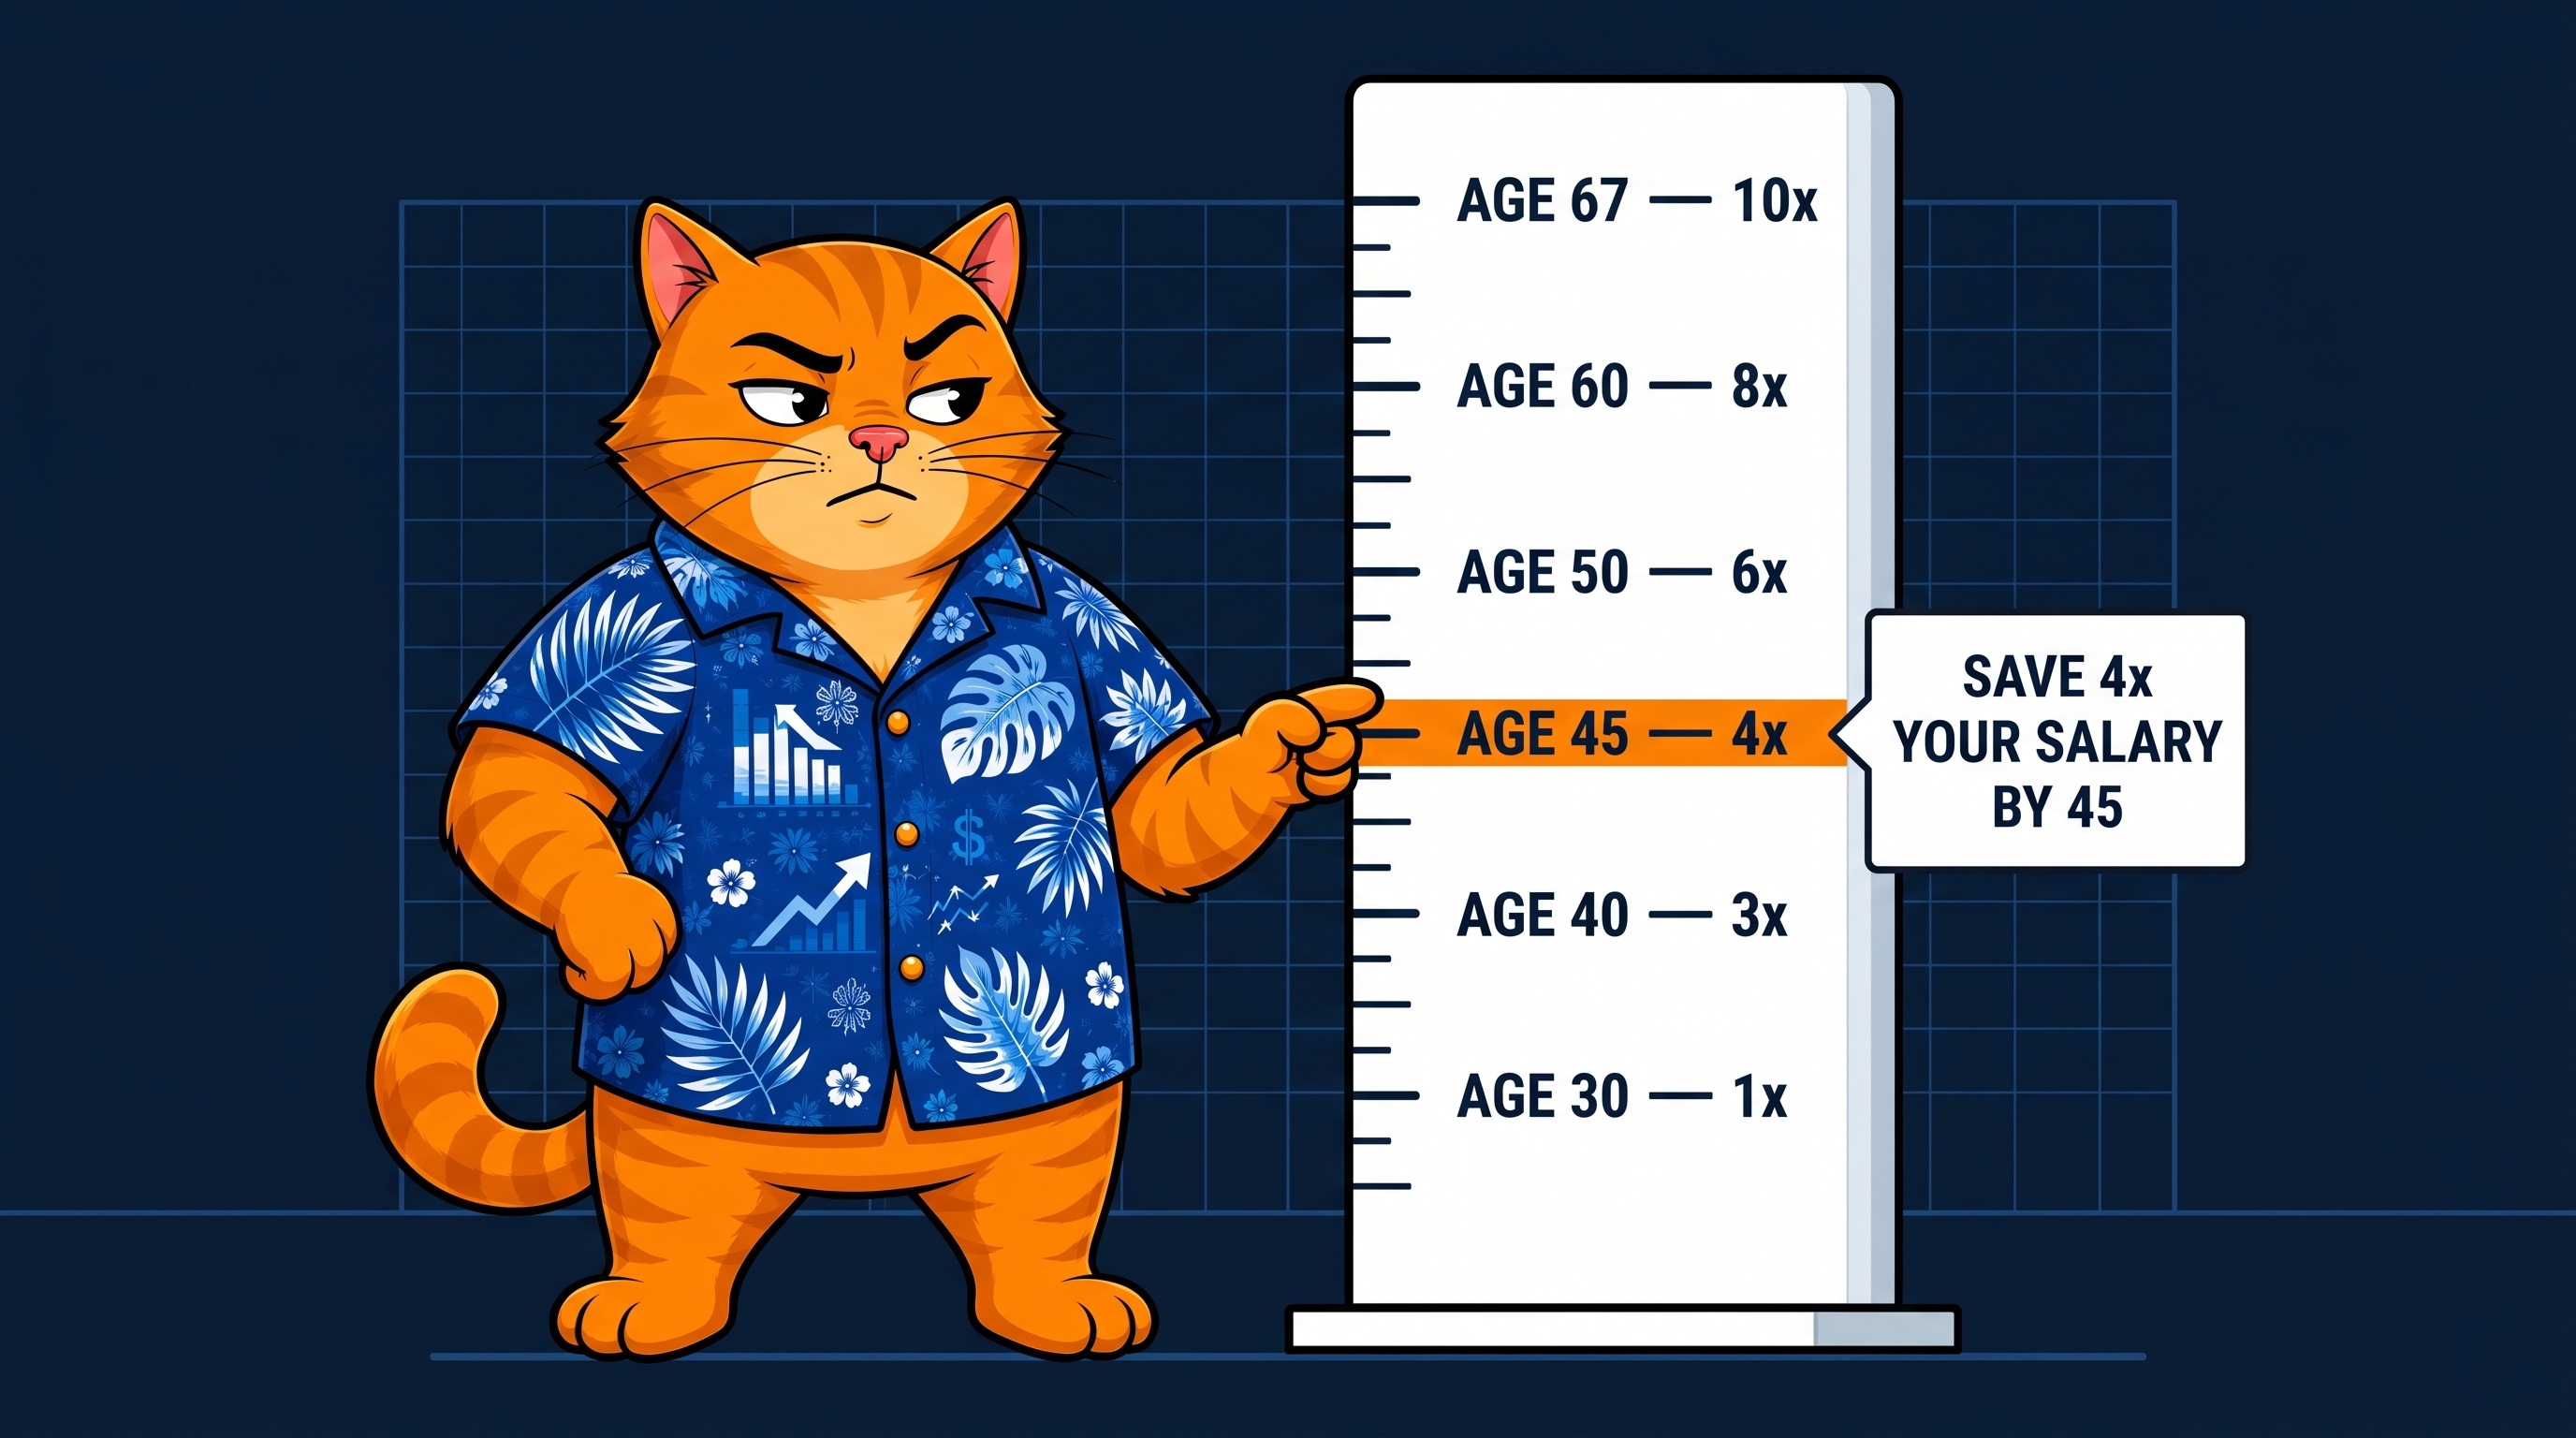
The version you've seen most often comes from Fidelity. It lays out savings milestones as multiples of your current income: 1x by 30, 2x by 35, 3x by 40, 4x by 45, 6x by 50, 7x by 55, 8x by 60, and 10x by 67.
It's clean, it's memorable, and it's genuinely useful. A single number you can hold in your head beats a blank spreadsheet, and "freezing" — saving nothing because the whole thing feels too big — is the real enemy. As a prompt to start, "1x your salary by 30" does its job.
The trouble starts when you treat a nudge like a diagnosis. The multiple isn't a measurement of you. It's the output of a model, and a model only works if your life matches the assumptions it was built on.
The five things the chart quietly assumes
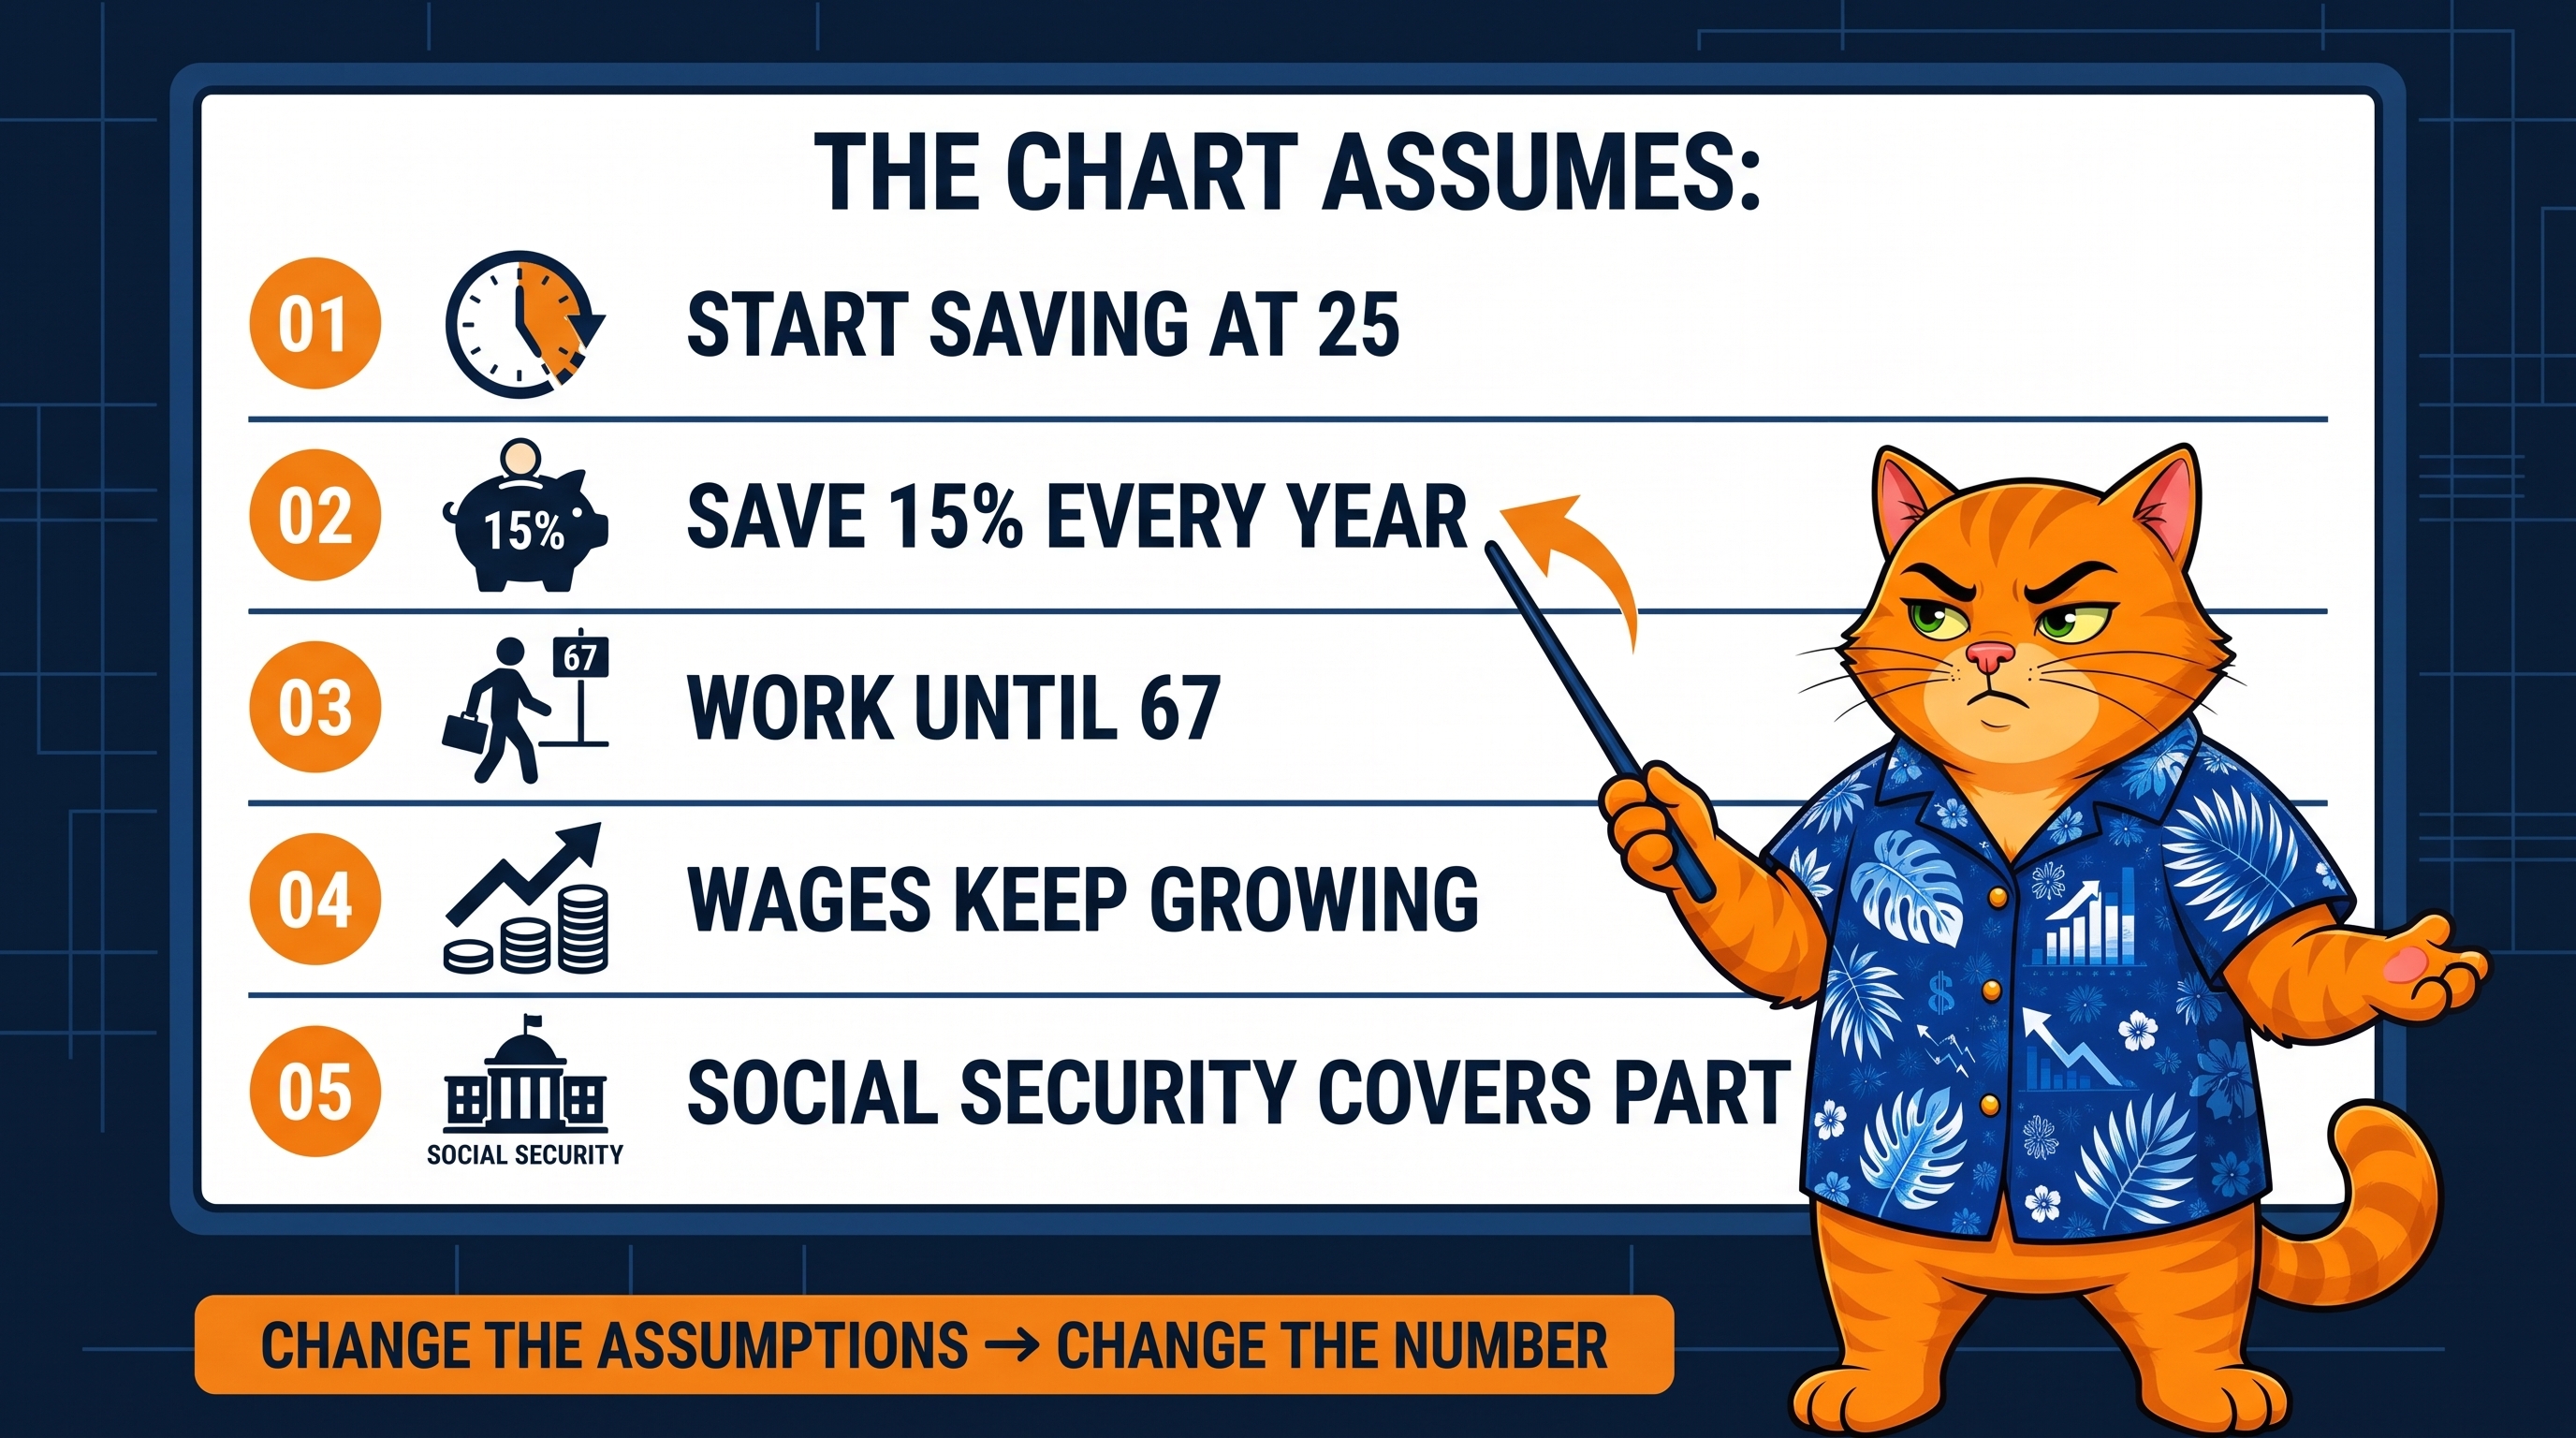
To land on 10x your salary by 67, Fidelity's model assumes all of the following:
- You started saving at 25.
- You save 15% of your income every year — including any employer match.
- You work until 67.
- Your wages grow over time (Fidelity's methodology assumes roughly 1.5% real growth a year).
- Social Security carries part of the load — your own savings are expected to replace about 45% of your pre-retirement income, not all of it.
Read that list back. The chart isn't telling you how much to save. It's telling you where you'd be if you had already done all of that. Start at 32 instead of 25, save 8% for a few years while you kill off a loan, plan to retire at 62 — and you're not "behind the chart." You're a different person than the one it was drawn for.
What people actually save — and why the gap matters
Here's a useful reality check. Vanguard runs workplace retirement plans for millions of people and publishes what those people actually do each year. In its most recent report, covering 2025, the average total contribution rate among participants — counting the employer's share — was about 12%.
The model starts at 15%. The average committed workplace saver is at roughly 12.1%. That's not proof the guideline is wrong. It's proof that the assumptions underneath a benchmark matter, and that a small gap in savings rate, held across a whole career, compounds into a large gap by the end.
So being below 4x your salary at 45 tells Christina something real: she's below the benchmark. It does not, by itself, tell her whether her retirement plan works — because the chart knows her age and her salary, and nothing else about her.
Three things that set your real number
Your salary is barely one of the inputs. Three things do most of the work.
1. What you'll spend, not what you earn
Retirement isn't funded against your job title. Your savings eventually have to help pay for your actual life — your rent or mortgage, your groceries, your routine.
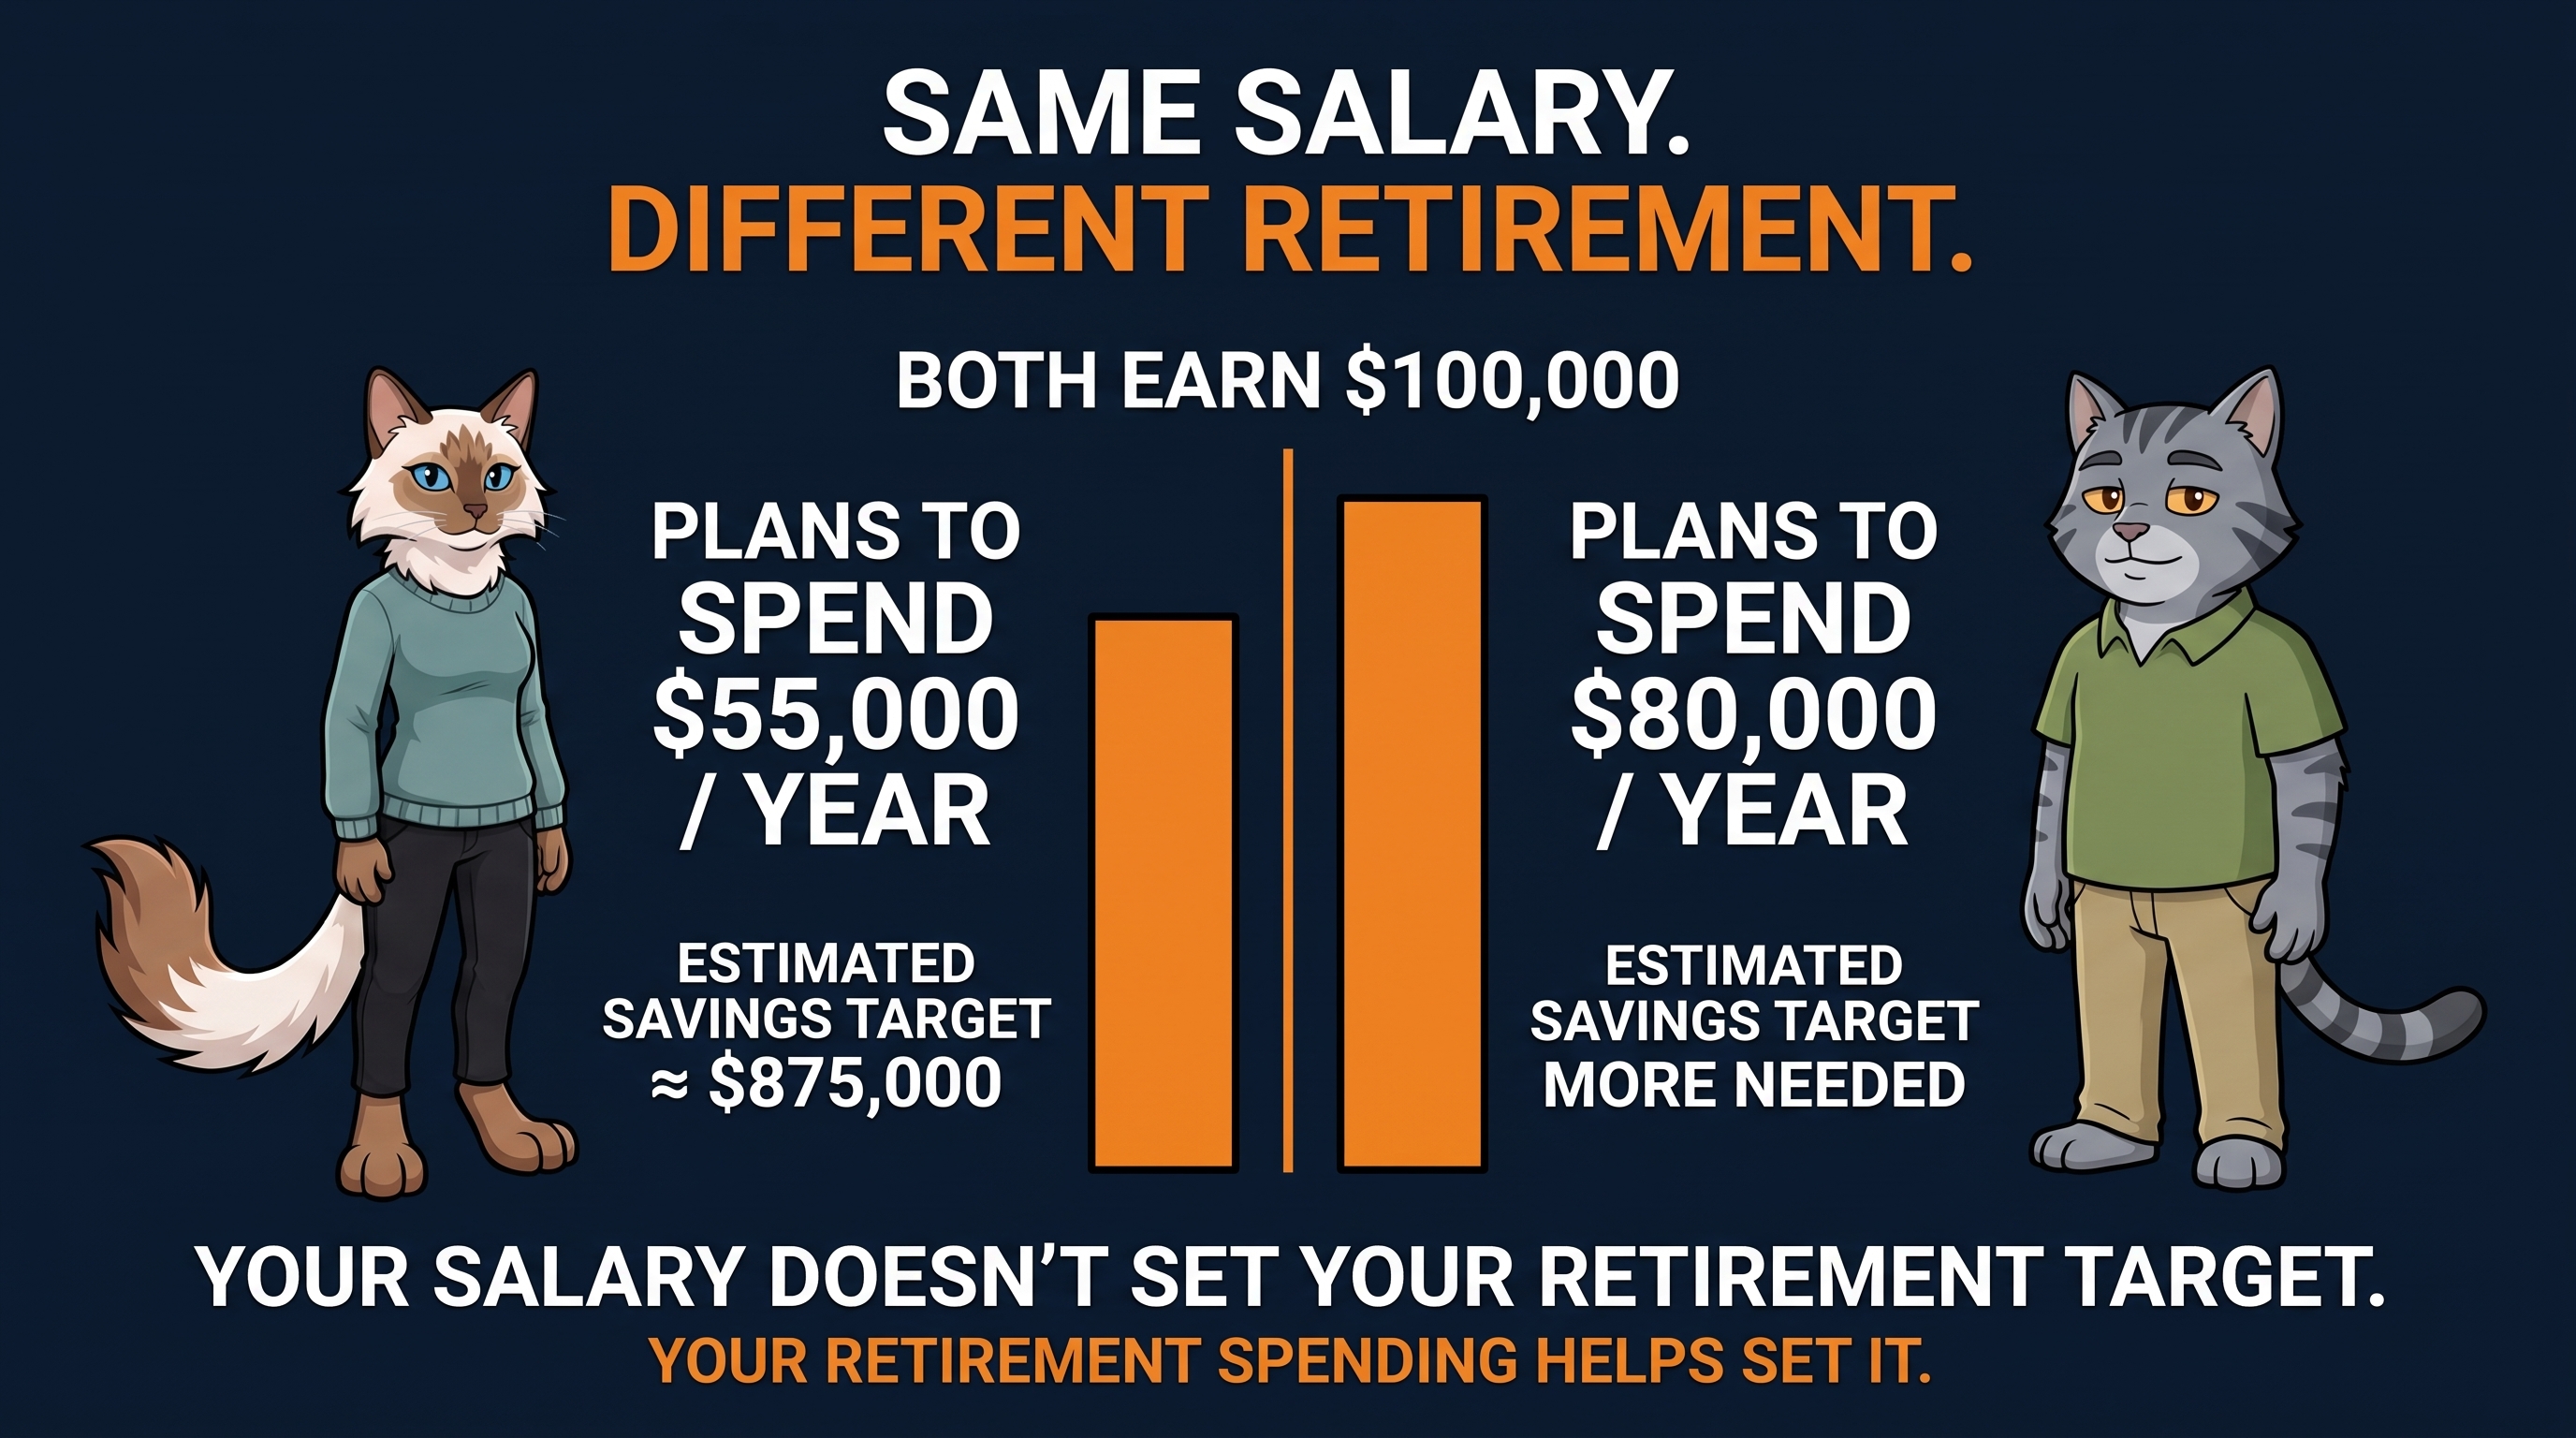
Take two people who each earn $100,000. Christina expects to live on about $55,000 a year in retirement. Her coworker Dale expects to need $80,000. Same salary, same age, same salary multiple — and completely different amounts of money required. The chart cannot tell them apart.
A spending-based estimate isn't magic either, but it lets you ask a better question: how much annual income will my savings actually need to produce? Fidelity suggests planning on an initial withdrawal of about 4–5% of your savings in year one. Flip 4% around and you get a rough 25x multiplier — whatever you expect to pull from savings in a year, you need somewhere around 25 times that saved.
Run Christina through it as an illustration only. She expects to spend $55,000 a year in retirement. Say Social Security eventually covers $20,000 of that. Her savings have to produce the other $35,000 a year — and at a 4% first-year withdrawal, that's roughly $35,000 x 25, or about $875,000 in the portfolio by the time she retires.
That answers a different question than the salary multiple does. 4x a $100,000 salary is $400,000 — a checkpoint for age 45, a rough read on whether she's tracking toward the model's retirement destination. The $875,000 is an estimate of where that destination actually sits for her, built from what she plans to spend instead of what she earns. The salary chart can't get to that second number, because it never asks what her life costs. (Neither figure accounts for taxes, investment returns, inflation, health care, or how long she lives — a real plan has to.)
2. When you plan to stop working
The 10x-by-67 number is built around retiring at 67. Move that age and the math moves with it. Work longer and you generally get more years of contributions, fewer retirement years for the portfolio to fund, and potentially a larger Social Security benefit if you also delay claiming. Retire earlier and the pressure runs the other way. "By 67" is doing a lot of quiet work in that sentence.
3. What Social Security and other reliable income actually cover
For a middle earner, Social Security replaces roughly 40% of career earnings. It's progressive — lower earners get a higher replacement percentage, higher earners get a lower one — so it is not your personal replacement rate.
One thing to avoid: don't take Fidelity's "your savings replace about 45%" figure, add a "40% from Social Security" figure, and declare yourself 85% funded. Those percentages are built from different calculations and don't simply stack. The useful takeaway is simpler — the more you earned, the more of the job your own savings have to do, and the less that chart's built-in Social Security assumption is working in your favor.
If the honest answer is "save more": the 2026 limits
If you run your own numbers and you genuinely need to save more, the contribution limits give you room to move.
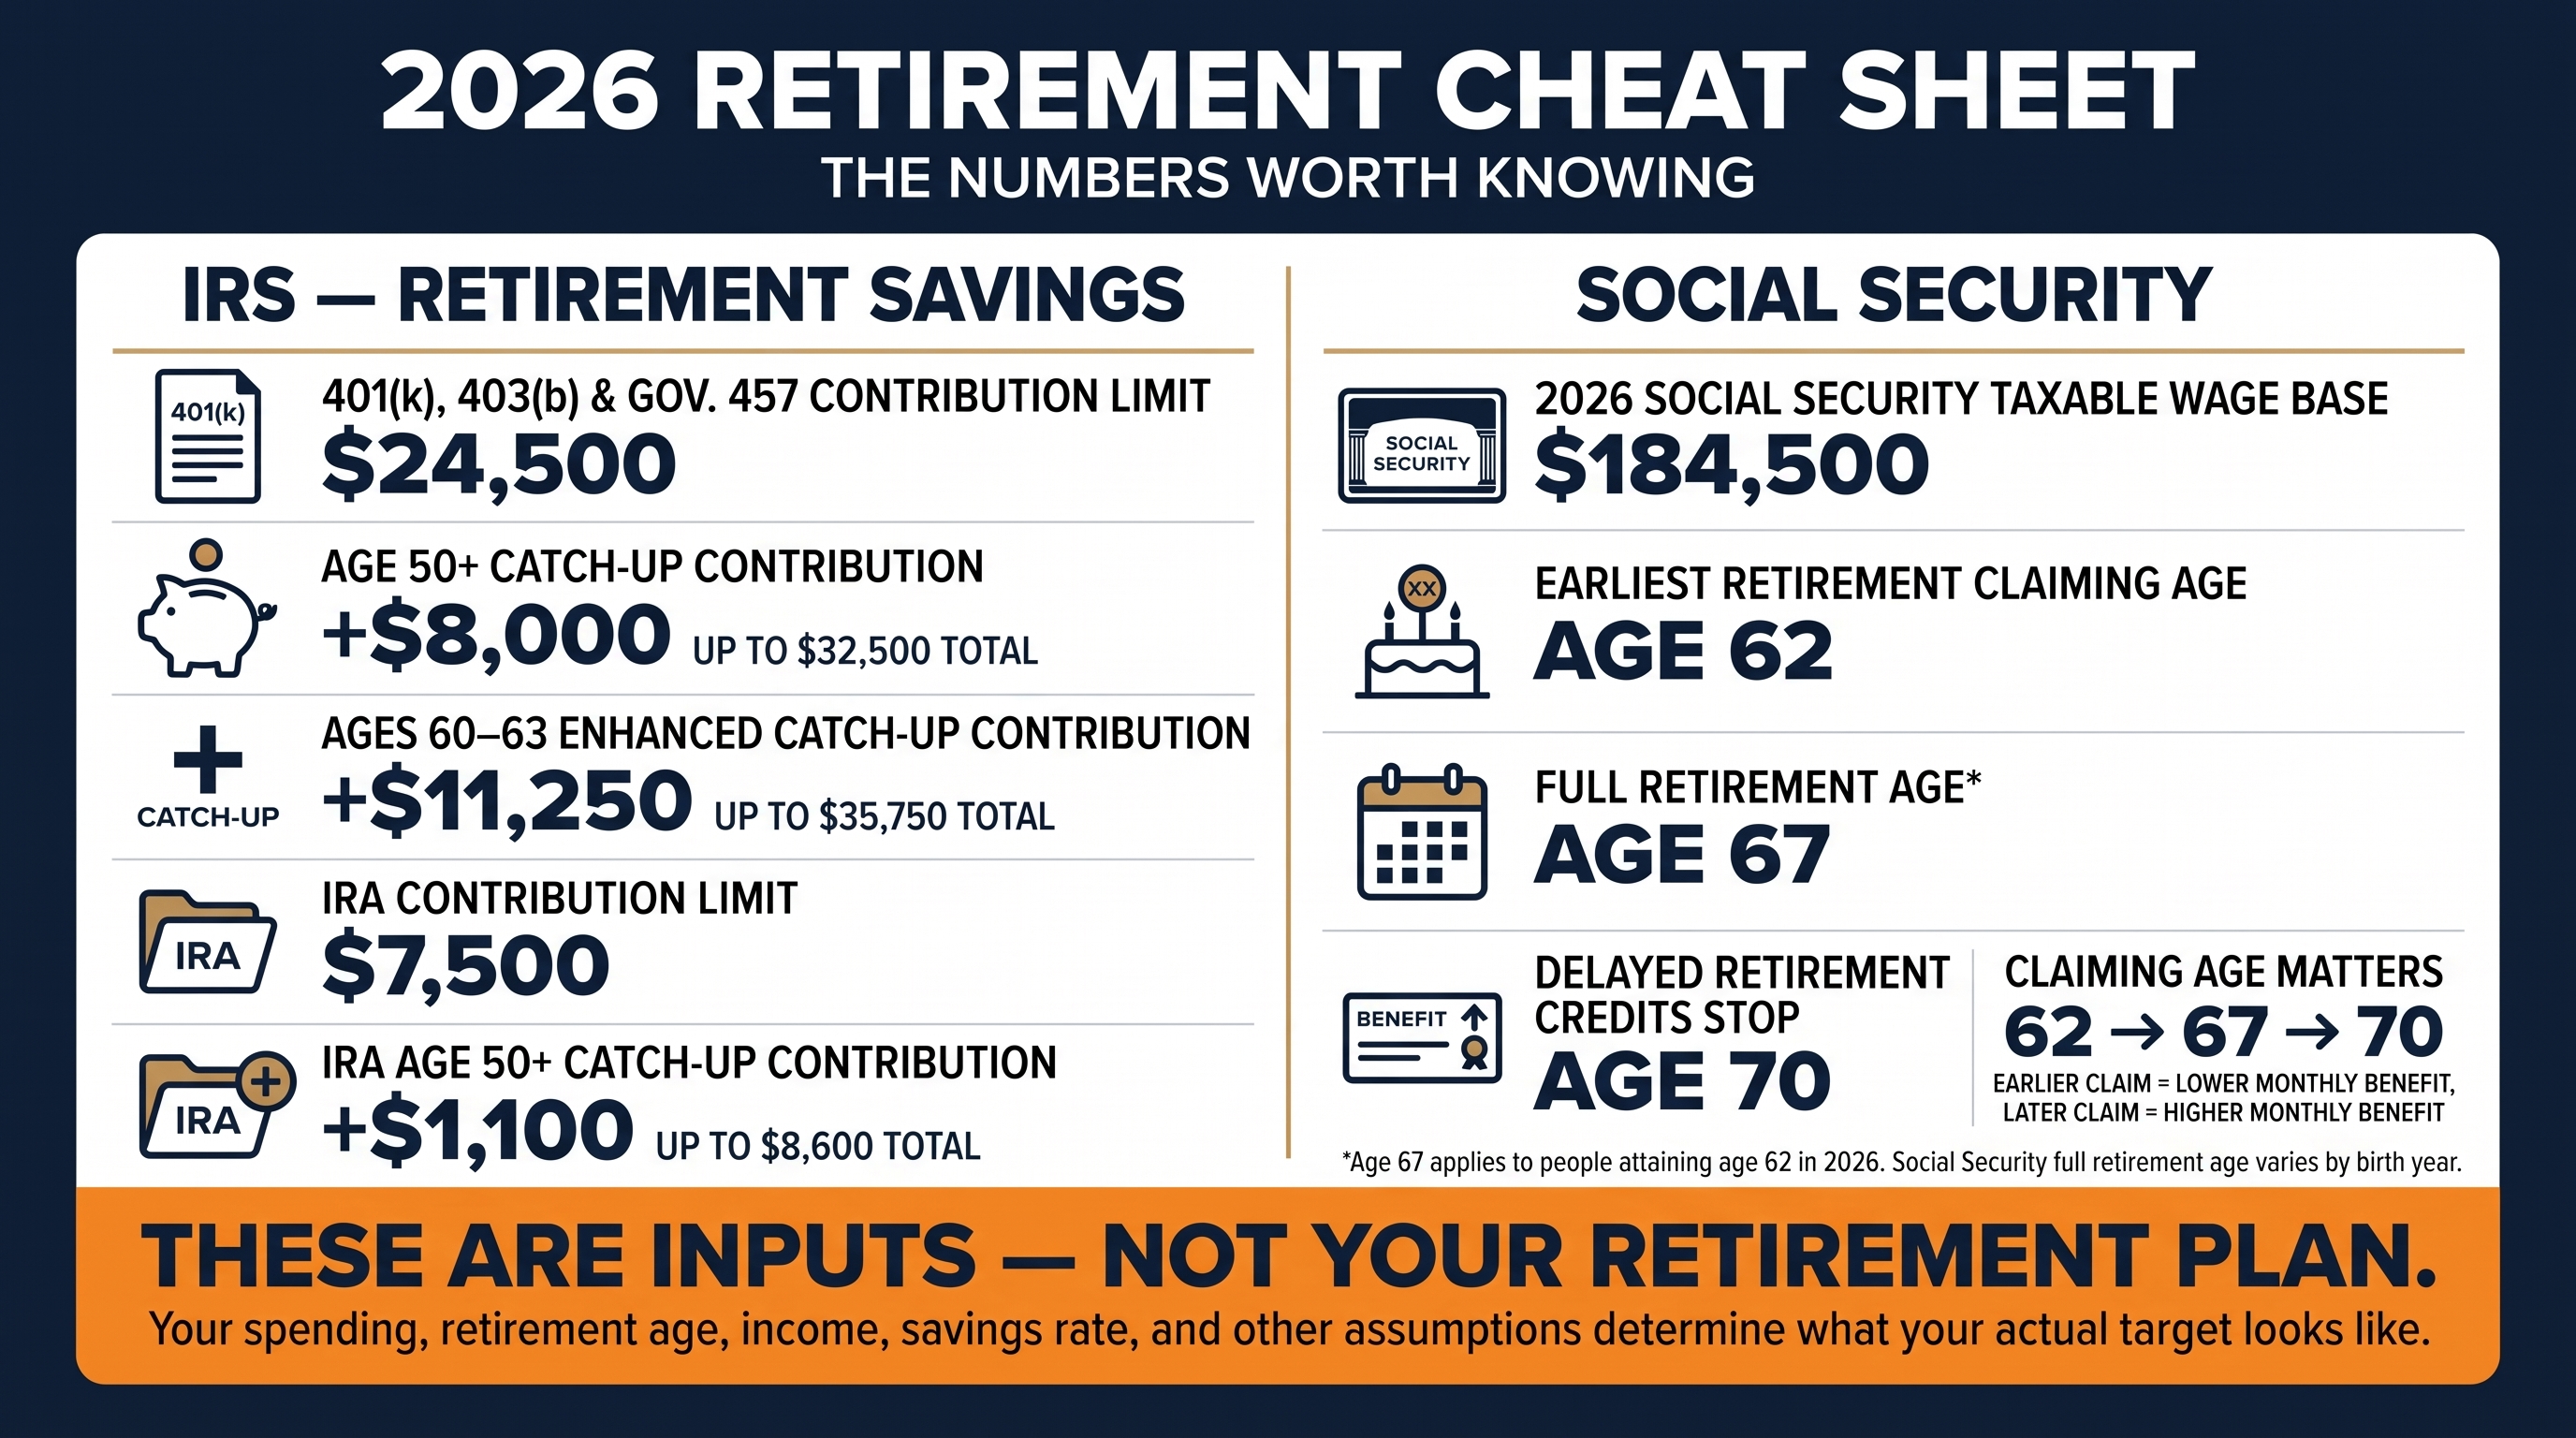
- Under 50: in 2026 you can contribute up to $24,500 to a 401(k) and $7,500 to an IRA.
- Age 50 and up: a standard 401(k) catch-up adds another $8,000, for up to $32,500 in employee 401(k) contributions.
- Ages 60–63: a larger "super catch-up" allows $11,250 instead of $8,000 — up to $35,750 in a 401(k) — if your plan offers it.
- One 2026 change to know: if your wages from that employer were more than $150,000 in 2025, your age-50+ catch-up generally has to go in as Roth — after-tax — rather than pre-tax.
You don't have to max any of it for an increase to matter. Ten years of an extra $8,000 a year is $80,000 in additional contributions before a single dollar of growth. The tax code gives people 50 and older extra room for exactly the years when catching up can move the needle. Being behind at 50 is common — you're not an outlier.
The Salary-Multiple Rule
1x your salary saved by 30, 3x by 40, 4x by 45, 6x by 50, 8x by 60, 10x by 67
4x a $100,000 salary is a $400,000 checkpoint for age 45 — but the size of the portfolio you'll actually need is set by your retirement spending (say $55,000 a year, minus what Social Security covers, times about 25), which the salary chart never asks about.
You don't need to claw your way back to a line on somebody's chart. You need your own number.
What you do with this information
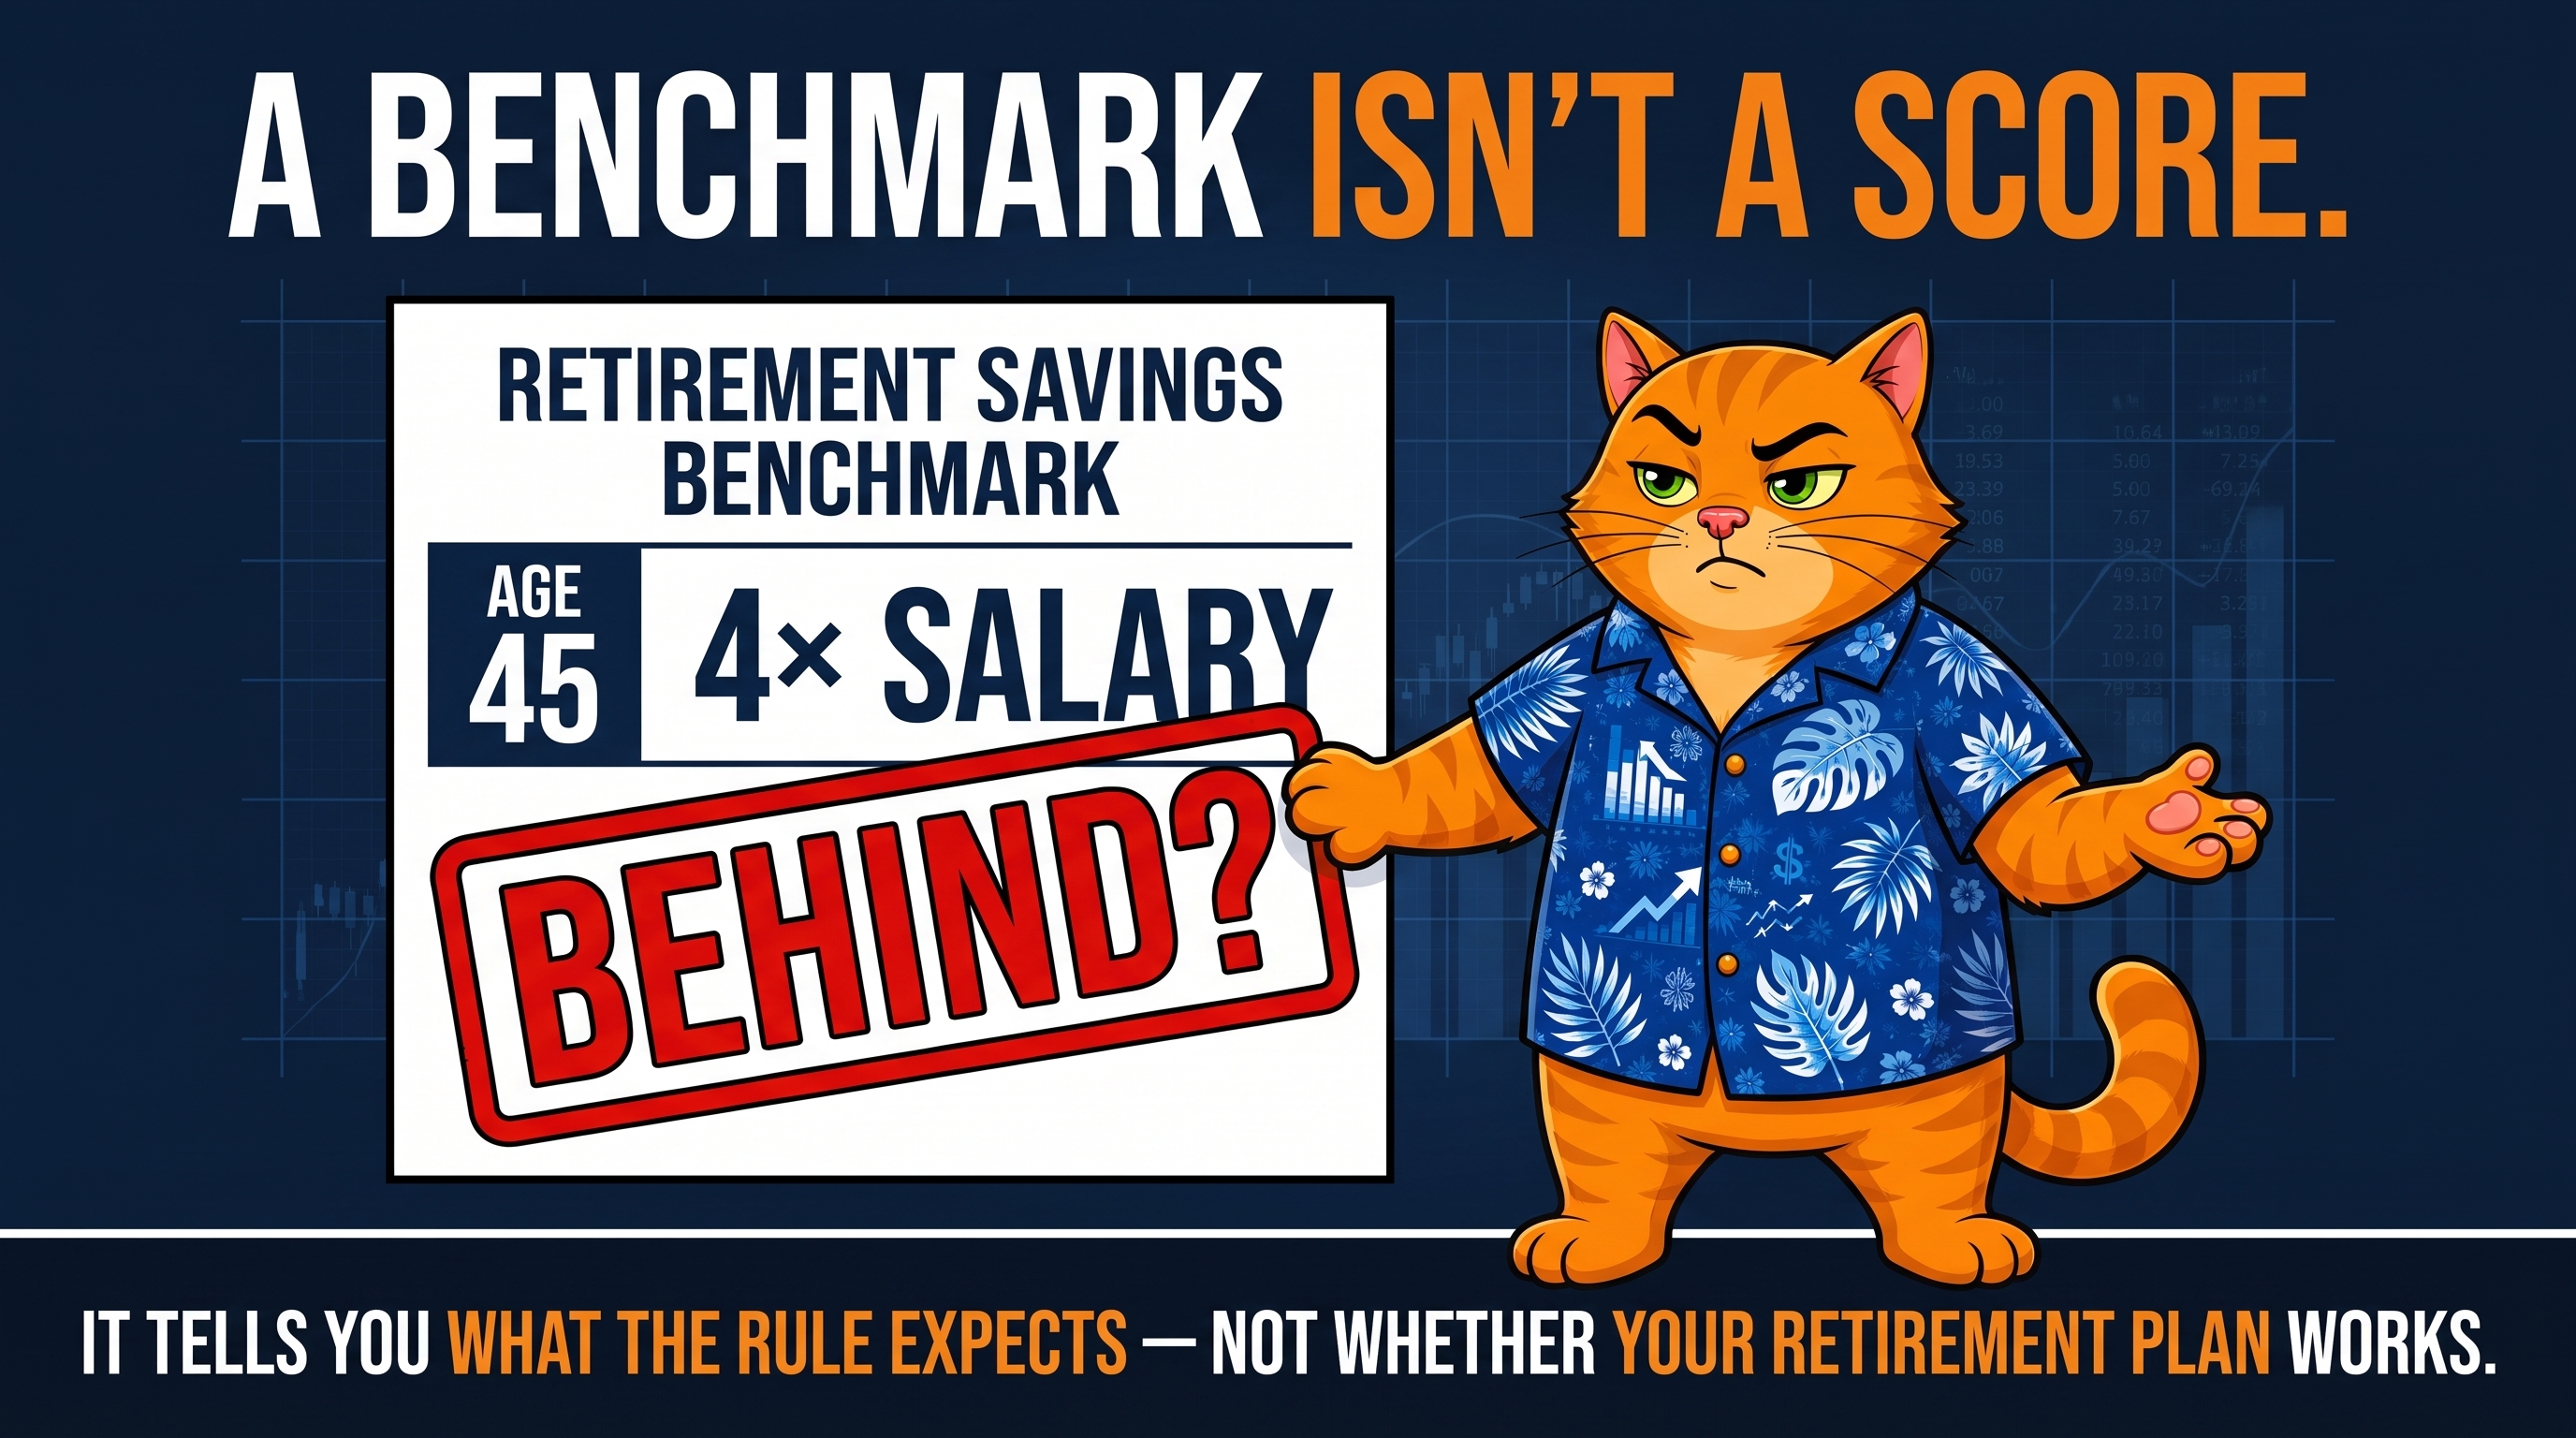
If you're 45 and nowhere near 4x your salary, the honest thing to say is that you have less room for error than someone who found the same gap at 25. That's real. But less room is not no room, and missing a benchmark is not the same thing as failing retirement. You weren't handed a test you failed. You were handed a chart built for a stranger and told it was a mirror.
So use the chart to make you look, then answer three questions it can't:
- What will your life actually cost in retirement?
- When do you actually want to stop working?
- What reliable income — Social Security, a pension — will be there besides your savings?
Those three won't produce a complete retirement plan. They're where a generic benchmark starts becoming yours. Christina wasn't wrong to look at 4x her salary, and the benchmark wasn't wrong to tell her she was below it. The mistake was asking one number to answer a bigger question than it could.
"Am I behind the benchmark?" Maybe. "Am I behind on retirement?" That's a different calculation. The chart is a checkpoint. It is not a scale, and it is not a sentence.
Watch the full breakdown on the channel, then run your own number — your spending, your target retirement age, the reliable income you'll have besides savings. A generic chart can't see any of it.
Related reading: Your 401k Match Is Free Money You're Leaving Behind · Roth IRA vs. Traditional IRA — Chuck Picks One · 2026 401(k) and IRA Contribution Limits, By Age, Explained Once
Sources
- Fidelity — Retirement Guidelines and How much money should I save? — savings milestones by age; 15% savings-rate, retire-at-67, ~4–5% initial withdrawal, ~1.5% real wage-growth assumptions. Accessed September 2026.
- Vanguard — How America Saves 2026 (25th edition) — average total participant + employer contribution rate ~12.1%, 2025 data.
- Social Security Administration — Fast Facts & Figures About Social Security and Office of the Chief Actuary materials — approximately 40% earnings replacement for a medium earner; progressive benefit structure. Average retired-worker benefit ≈ $2,086/month, SSA Monthly Statistical Snapshot, July 2026.
- Internal Revenue Service — "401(k) limit increases to $24,500 for 2026, IRA limit increases to $7,500" (IR-2025-111), November 13, 2025 — 2026 401(k) employee limit $24,500; IRA $7,500; age-50 catch-up $8,000; ages 60–63 catch-up $11,250. IRS guidance on Roth catch-up contributions — beginning in 2026, participants whose prior-year wages with the plan sponsor exceeded $150,000 must make applicable catch-up contributions on a Roth basis.
Chuck Finance is for entertainment and informational purposes only. Chuck is not a licensed financial advisor, and nothing here constitutes professional financial, investment, legal, or tax advice. Always consult a qualified professional before making financial decisions.